✅ Consistent
The data follows the pattern the hypothesis predicted. The more results that fit, the stronger the support.
Sign up to access the complete lesson and track your progress!
Unlock This CourseData can come as words, diagrams, graphs, symbols or numbers. Your job is to look for a pattern or trend, then say what it means.
Follow these steps every time:
Say a student heats water in a water bath and adds a solid until no more will dissolve. The table shows how much dissolves at each temperature.
| Temperature (°C) | Mass dissolved in 100 g of water (g) |
|---|---|
| 20 | 32 |
| 40 | 64 |
| 60 | 96 |
The trend: as the temperature goes up, the mass dissolved goes up. It goes up by 32 g for every 20°C. So you can make a prediction: at 50°C about 80 g should dissolve.
Be careful with predictions. They are safest between your data points. Going far outside your data is a guess, because the pattern might change.
Key terms:
Once you have data, you comment on the extent to which the data is consistent with the hypothesis. That means: how well does it fit?
The data follows the pattern the hypothesis predicted. The more results that fit, the stronger the support.
The data goes against the prediction. Then the hypothesis may need to change.
Data can fit partly. Then say so: "The data mostly supports the hypothesis, but the result at one temperature does not fit the trend."
Sometimes you must pick the better of two hypotheses. Here is how:
Always give the reason, using the data, not just your opinion.
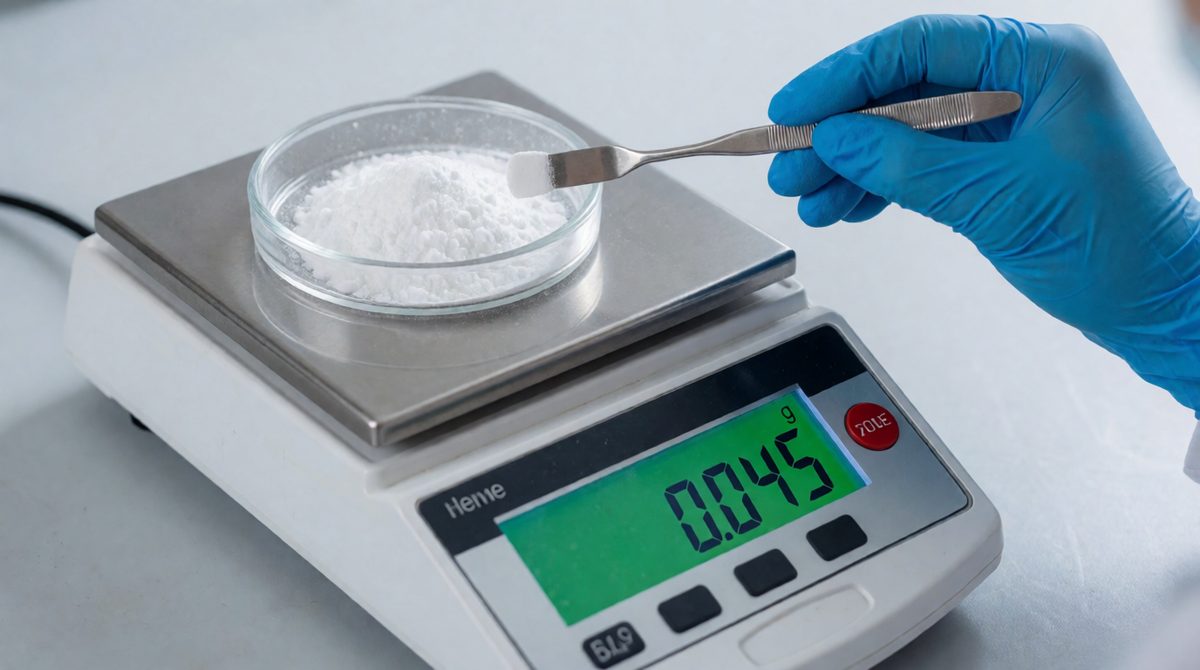
A balance that isn't zeroed gives readings that are precise but not accurate - a systematic error
Being objective means judging results fairly, using the evidence and not what you hoped to see. Four ideas help you do this.
Key terms:
Picture a target. The true value is the centre.
All the darts land close together, but far from the centre.
All the darts land close together, right on the centre.
So a set of results can be precise without being accurate. Precise results alone do not tell you whether they are close to the truth.
Students swap repeatable and reproducible. Remember: repeatable is the same person with the same kit. Reproducible is a different person with different equipment. Reproducible results are more convincing, because someone else got them too.
No measurement is perfect. Errors come in two types.
Results vary in unpredictable ways. Some are a bit high, some a bit low. Reduce it by making more measurements and reporting a mean value.
Results differ from the true value by a consistent amount each time. Repeating and averaging does not remove it.
A student reads a thermometer in boiling pure water at normal pressure. Three readings are 98.2°C, 98.4°C and 98.3°C. They are close together, so they are precise. But pure water boils at 100°C at normal pressure. Every reading is about 1.7°C too low. That is a systematic error, and it makes the results precise but not accurate. A thermometer that is wrongly marked would cause it.
Now a different student reads a burette in a titration and gets 22.4, 22.9, 22.1 and 22.6 cm3. They vary in no set direction. That is random error, perhaps from judging the liquid level by eye. Taking more readings and finding the mean reduces it.
An anomalous value is a result that does not fit the pattern of the others. Do not ignore it straight away.
Never just remove a result because you do not like it. That is not being objective.
When you evaluate data, you can suggest improvements to the procedure. Match the improvement to the problem:

A good report explains the aim, method, findings and conclusion in a clear, logical order
Science is only useful if people understand it. When you write a report or give a presentation, make it coherent and logically structured. A good report covers:
Use correct scientific vocabulary, units, symbols and chemical names. Write "25 cm3 of dilute hydrochloric acid", not "some acid". You can do this on paper or on a screen. You will need these skills when you evaluate the required practicals and in the exam.
A student measures the mass of a solid on a balance five times. The readings are 5.02 g, 5.03 g, 5.01 g, 5.02 g and 5.03 g. The true mass of the solid is 4.50 g. The balance had not been set to zero before use.
(a) Are the results precise? Give a reason. (b) Are they accurate? Give a reason. (c) What type of error caused this? (2 + 2 + 1 marks)
(a) Yes, they are precise because they are all very close together (5.01 to 5.03 g). (b) No, they are not accurate because they are not close to the true value of 4.50 g; each is about 0.5 g too high. (c) Systematic error, because the readings are wrong by a consistent amount each time.
Use the data in your answer. Quote numbers, and say "close together" for precision and "close to the true value" for accuracy.