📊 On a number line
Draw a number line and put a dot or cross for each result. If the dots are bunched close together, the spread is small. If they are far apart, the spread is large. The mean sits somewhere in the middle of the dots.
Sign up to access the complete lesson and track your progress!
Unlock This Course
Three stopwatches, three slightly different times: every measurement has some uncertainty, so we repeat and take a mean
Imagine three students time how long it takes for the same reaction to finish. They use the same chemicals and the same method. One gets 41 seconds, one gets 43 seconds and one gets 44 seconds. Nobody has cheated. So which answer is the true one?
The honest answer is that we cannot know the true value exactly. Whenever a measurement is made there is always some uncertainty about the result obtained. This is true for a top scientist in a research lab, and it is true for you in a school lab.
Uncertainty comes from lots of small things that are hard to control:
Because of this, scientists repeat measurements. The repeats give a set of results that are spread out a little. We then use that spread to say how sure we are about the answer.
Key terms:
The spec asks you to represent the distribution of results. This just means showing how the repeat results are spread out, so you can see them all at once.
Draw a number line and put a dot or cross for each result. If the dots are bunched close together, the spread is small. If they are far apart, the spread is large. The mean sits somewhere in the middle of the dots.
On a graph, plot the mean as the point. Then draw a short vertical line through it from the lowest repeat to the highest repeat. This line shows the range. A long line means a big uncertainty. A short line means a small uncertainty.
Both ways let you see two things together: the typical value (the mean) and how much the results vary (the range).
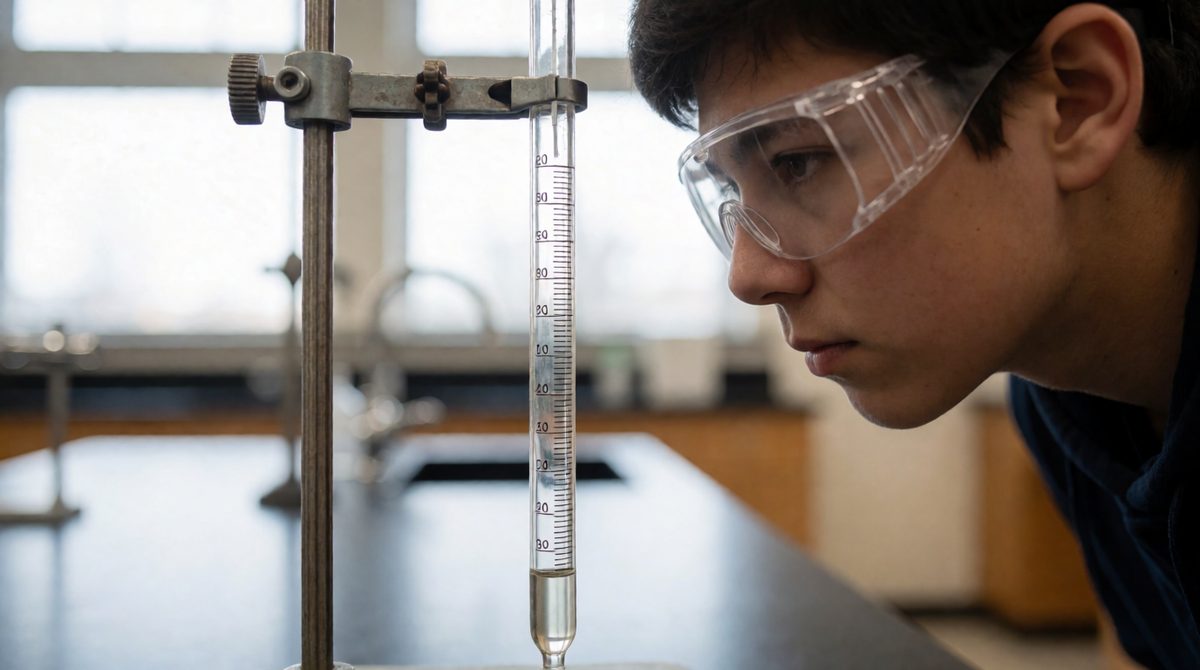
Repeat readings from a burette spread out a little, and half the range about the mean gives your uncertainty
AQA wants you to use the range of a set of measurements about the mean as a measure of uncertainty. Here is the method you should learn:
Why half the range? Because the results spread out on both sides of the mean. Half the range goes up from the mean, and half goes down. The sign ± means "plus or minus".
A student mixes an acid and an alkali three times and records the temperature rise: 6.8 °C, 7.2 °C and 7.0 °C.
Mean = (6.8 + 7.2 + 7.0) ÷ 3 = 21.0 ÷ 3 = 7.0 °C
Range = 7.2 − 6.8 = 0.4 °C
Uncertainty = 0.4 ÷ 2 = 0.2 °C
Result: 7.0 ± 0.2 °C. The true temperature rise is probably somewhere between 6.8 °C and 7.2 °C.
A student collects gas from a reaction for 60 seconds, four times: 42 cm3, 45 cm3, 39 cm3 and 46 cm3.
Mean = (42 + 45 + 39 + 46) ÷ 4 = 172 ÷ 4 = 43 cm3
Range = 46 − 39 = 7 cm3
Uncertainty = 7 ÷ 2 = 3.5 cm3
Result: 43 ± 3.5 cm3.
Two groups measure the mass of solid made in a reaction.
Group A: 2.45 g, 2.50 g, 2.55 g. Mean = 2.50 g. Range = 0.10 g. Uncertainty = ± 0.05 g.
Group B: 2.30 g, 2.50 g, 2.70 g. Mean = 2.50 g. Range = 0.40 g. Uncertainty = ± 0.20 g.
Both groups have the same mean. But Group A's results are bunched more closely, so their uncertainty is smaller. We can be more sure about Group A's answer.
Uncertainty helps you decide if a difference between two results is real. Say one reaction gives 43 ± 3.5 cm3 of gas and another gives 45 ± 3.0 cm3. The first could be anywhere from 39.5 to 46.5 cm3. The second could be anywhere from 42 to 48 cm3. These overlap, so you cannot be sure the second reaction really made more gas.
If the two ranges do not overlap at all, you can be more confident there is a real difference.
A smaller uncertainty means a more trustworthy result. Taking repeats and reading scales carefully at eye level both help. The ideas of accuracy, precision and errors are covered in Interpreting and Evaluating Data.
A student measured the time taken for a piece of magnesium ribbon to react completely with hydrochloric acid. They repeated the experiment three times.
Results: 52 s, 48 s, 50 s
(a) Calculate the mean time. [1 mark]
(b) Estimate the uncertainty in the mean. Give your answer in the form mean ± uncertainty. [2 marks]
(c) Explain why the student's results were not all the same. [1 mark]
(a) Mean = (52 + 48 + 50) ÷ 3 = 150 ÷ 3 = 50 s (1)
(b) Range = 52 − 48 = 4 s, so uncertainty = 4 ÷ 2 = 2 s (1). Answer: 50 ± 2 s (1)
(c) There is always some uncertainty when a measurement is made, for example from starting and stopping the stopwatch at slightly different moments (1).
When a question says "estimate the uncertainty", show all three steps: the mean, the range, then half the range. Write your final answer as mean ± uncertainty with a unit. Each step can earn a mark even if you slip later on.