🔥 Exothermic
Products are lower than reactants. The overall energy change goes down. Energy is given out to the surroundings.
Sign up to access the complete lesson and track your progress!
Unlock This Course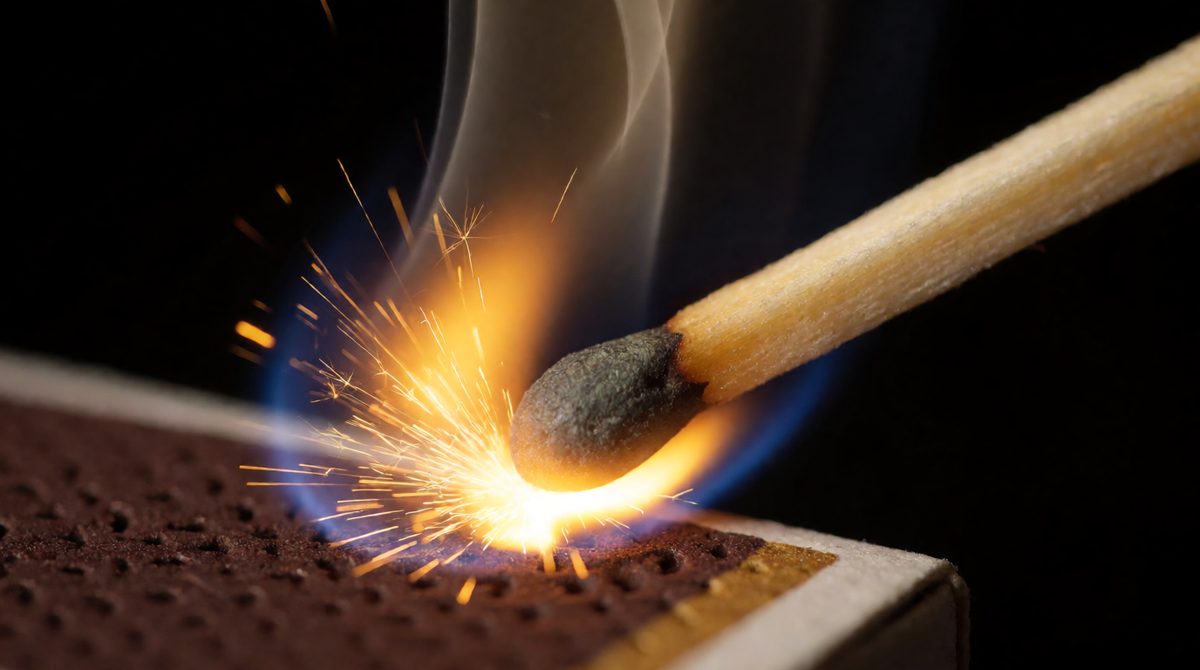
A match won't light until you strike it - the friction supplies the activation energy to get the reaction going
Chemical reactions can only happen when the reacting particles collide with each other. But a collision on its own is not enough. The particles must also hit each other with enough energy. If they bump together too gently, they just bounce apart and nothing changes.
Think about pushing a ball up a small hill. If you push too softly, it rolls back down. You need to give it enough energy to get over the top. Reacting particles are the same. They need a minimum amount of energy before they can turn into products.
Key terms:
A reaction profile is a graph that follows a reaction from start to finish.
The line starts at a flat level for the reactants. It then rises to a peak. Then it falls to a flat level for the products. The peak is the point where the particles have just enough energy to react.
Measured from the energy of the reactants up to the top of the peak. It is the energy needed for the reaction to occur.
The difference in height between the reactants and the products. It shows whether the products have more or less energy than the reactants.
The flat parts of the line at the start and the end. They show the relative energies of the reactants and the products.
The activation energy is always drawn as an arrow that goes up from the reactants to the top of the peak. The overall energy change is drawn as an arrow between the level of the reactants and the level of the products.
In an exothermic reaction, energy is transferred to the surroundings. So the products end up with less energy than the reactants.
To draw the profile:
The products are lower than the reactants, so the overall energy change arrow points downwards.
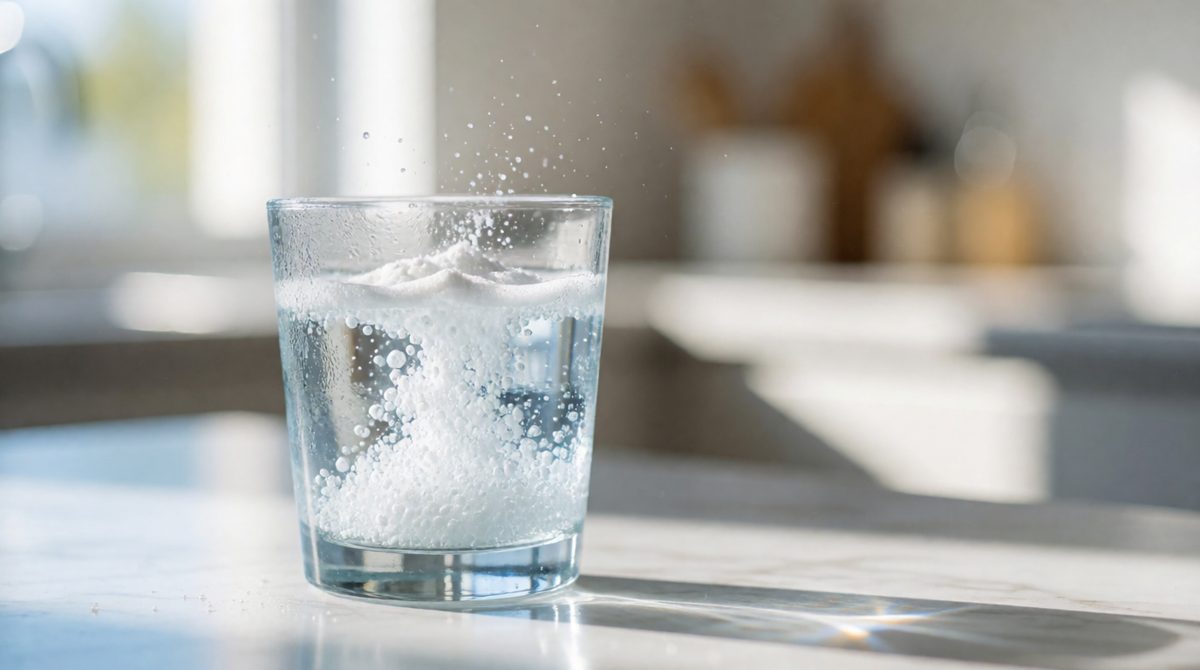
Sherbet's fizz in water is endothermic - the products end up with more energy than the reactants, so it feels cool
In an endothermic reaction, energy is taken in from the surroundings. So the products end up with more energy than the reactants.
The drawing steps are the same, but the end of the curve is different. The curve rises to a peak, then falls only a little way, and the flat line for the products is higher than the start. The overall energy change arrow points upwards.
Products are lower than reactants. The overall energy change goes down. Energy is given out to the surroundings.
Products are higher than reactants. The overall energy change goes up. Energy is taken in from the surroundings.
You may be given a reaction profile and asked what type of reaction it shows. Do not try to guess from the size of the peak. Just compare the two flat lines:
Every reaction profile has an activation energy peak, whether the reaction is exothermic or endothermic. Even a reaction that gives out lots of energy needs a push to get going. This is why a pile of coal does not burst into flames by itself. It needs a spark or a flame to give the first particles enough energy. Once the reaction starts, the energy it gives out helps to keep it going.
A reaction profile shows reactants at an energy of 50 units, a peak at 120 units and products at 30 units.
Activation energy = peak minus reactants = 120 - 50 = 70 units.
The products (30) are lower than the reactants (50), so the reaction is exothermic. The overall energy change is 50 - 30 = 20 units given out.
Measuring the activation energy from the bottom of the graph. It is measured from the reactants up to the peak.
Thinking an exothermic reaction needs no activation energy. All reactions have a peak.
Drawing a straight line or a zigzag. Draw a smooth curve.
Forgetting to label the axes, the reactants and the products.
Mixing up the direction of the overall energy change arrow. Down means exothermic, up means endothermic.
The reaction profile for a reaction shows the products at a higher energy level than the reactants. (a) Is the reaction exothermic or endothermic? Give a reason. (b) What does the difference in height between the reactants and the top of the peak represent? (c) Describe what happens to the temperature of the surroundings.
(a) Endothermic, because the products have more energy than the reactants.
(b) The activation energy, which is the minimum energy the particles must have to react.
(c) The surroundings get colder, because energy is taken in from the surroundings.
When you draw a profile, always add both arrows: one for the activation energy (up to the peak) and one for the overall energy change (between the reactants and products levels).