⚖ Mass
Quantity in grams and time in seconds gives a rate in g/s.
Sign up to access the complete lesson and track your progress!
Unlock This Course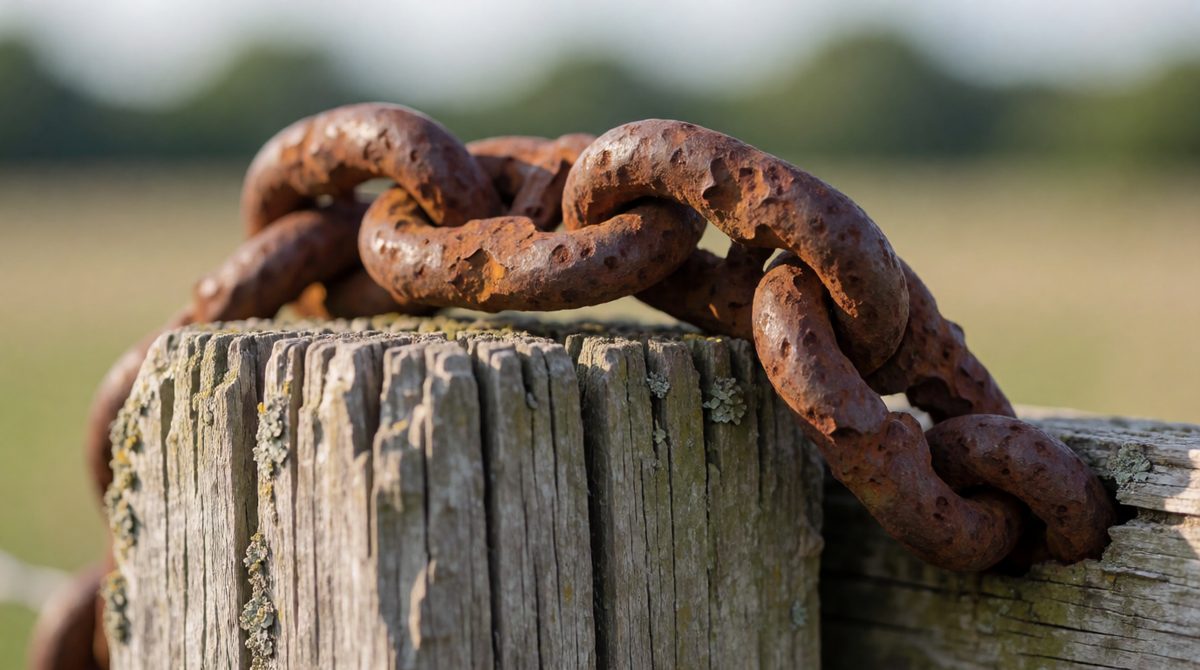
Rusting is a slow reaction - it can take months, while a firework reacts in a split second
Some reactions are slow, like iron going rusty. Some are fast, like a firework. The rate of reaction tells us how quickly a reaction happens. To find it, we measure how much reactant is used up, or how much product is made, over a period of time.
Because the rate can change as the reaction goes on, we usually work out the mean rate. This is the average rate over the whole time we measured.
mean rate of reaction = quantity of reactant used ÷ time taken
mean rate of reaction = quantity of product formed ÷ time taken
The "quantity" can be a mass in grams (g) or a volume in cm3. A gas is often measured as a volume. A solid reactant is often measured as a mass.
Key terms:
The unit of rate comes from the equation. It is the unit of the quantity divided by the unit of time.
Quantity in grams and time in seconds gives a rate in g/s.
Quantity in cm3 and time in seconds gives a rate in cm3/s.
At Higher tier you can also measure the quantity in moles. The rate is then in mol/s.
If the time is given in minutes, change it to seconds first (multiply by 60) so the unit is /s.
A reaction makes 48 cm3 of gas in 120 seconds.
Mean rate = 48 ÷ 120 = 0.40 cm3/s
A student starts with 5.0 g of a solid reactant. After 30 seconds, 2.0 g is left.
Mass used = 5.0 − 2.0 = 3.0 g
Mean rate = 3.0 ÷ 30 = 0.10 g/s
A reaction uses up 0.060 mol of a reactant in 40 seconds.
Mean rate = 0.060 ÷ 40 = 0.0015 mol/s
Notice that for a reactant you use the amount used up (start minus what is left), not the amount left.
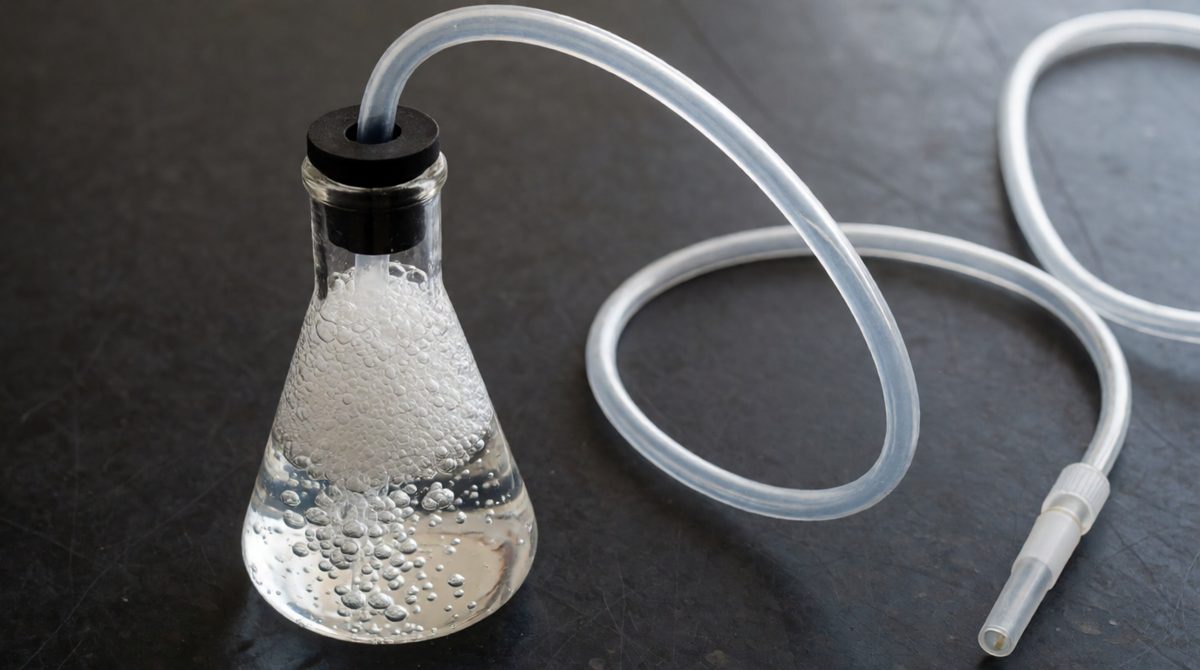
Collect the gas in a syringe and note the volume every 10 seconds - then plot it against time
We can measure the quantity every few seconds and plot a graph. Time goes on the x-axis (the horizontal one). The quantity goes on the y-axis (the vertical one). Here is a set of results for a reaction that makes a gas:
| Time (s) | 0 | 10 | 20 | 30 | 40 | 50 | 60 |
|---|---|---|---|---|---|---|---|
| Gas made (cm3) | 0 | 24 | 38 | 46 | 50 | 52 | 52 |
To draw the graph, plot each point with a small cross, then draw a smooth curve through them. Do not join the dots with straight ruler lines.
The reaction is fast. Lots of product forms each second.
The reaction is slowing down because the reactants are being used up.
The reaction has stopped. At least one reactant has run out.
In our results the curve is steepest at the start. In the first 10 seconds the mean rate is 24 ÷ 10 = 2.4 cm3/s. Between 20 and 30 seconds it is only 8 ÷ 10 = 0.8 cm3/s. After 50 seconds the line is flat, so the rate is zero.
A graph for a reactant going down starts high and falls. It is steepest at the start and then flattens out as the reactant is used up. The steeper the line, the faster the reaction.
You can compare two curves on the same axes. The curve that is steeper at the start, or reaches its flat part sooner, is the faster reaction.
A mean rate is an average. But the rate at one exact moment can be different. To find it, we draw a tangent to the curve. A tangent is a straight line that just touches the curve at one point, without cutting across it. The slope of the tangent is a measure of the rate at that point.
How to draw a tangent at a chosen time:
A steeper tangent means a faster rate at that time. A flat tangent means the reaction has stopped.
Key term:
You can work out the rate at a specific time by calculating the gradient of the tangent.
gradient = change in y ÷ change in x
Worked example: A student draws a tangent at 20 s on the gas graph above. It passes through (0 s, 16 cm3) and (40 s, 60 cm3).
Change in y = 60 − 16 = 44 cm3
Change in x = 40 − 0 = 40 s
Gradient = 44 ÷ 40 = 1.1 cm3/s
So the rate at 20 s is 1.1 cm3/s. Choose two points far apart on the tangent line, not points on the curve.
For a graph that falls, the gradient is negative. We just state the size of the rate as a positive number.
1. Using the amount of reactant left instead of the amount used up.
2. Leaving the time in minutes but writing the unit as /s.
3. Joining plotted points with straight lines instead of drawing a smooth curve.
4. Drawing a tangent that cuts through the curve.
5. (Higher tier) Reading the gradient from two points on the curve instead of two points on the tangent.
A student reacts marble chips with acid. The reaction makes 90 cm3 of carbon dioxide in 150 seconds.
(a) Calculate the mean rate of reaction in cm3/s. (2 marks)
(b) The graph of volume against time becomes flat after 150 seconds. What does this tell you? (1 mark)
(a) Mean rate = quantity of product formed ÷ time taken = 90 ÷ 150 = 0.60 cm3/s
(b) The reaction has stopped, because at least one reactant has been used up.
Write the equation first, then put the numbers in, then give the answer with its unit. The unit often earns a mark.