💰 Production is more profitable
A higher price means more revenue from each unit sold, while costs stay much the same. Selling the good becomes more profitable, so firms want to produce and sell more of it.
Sign up to access the complete lesson and track your progress!
Unlock This Course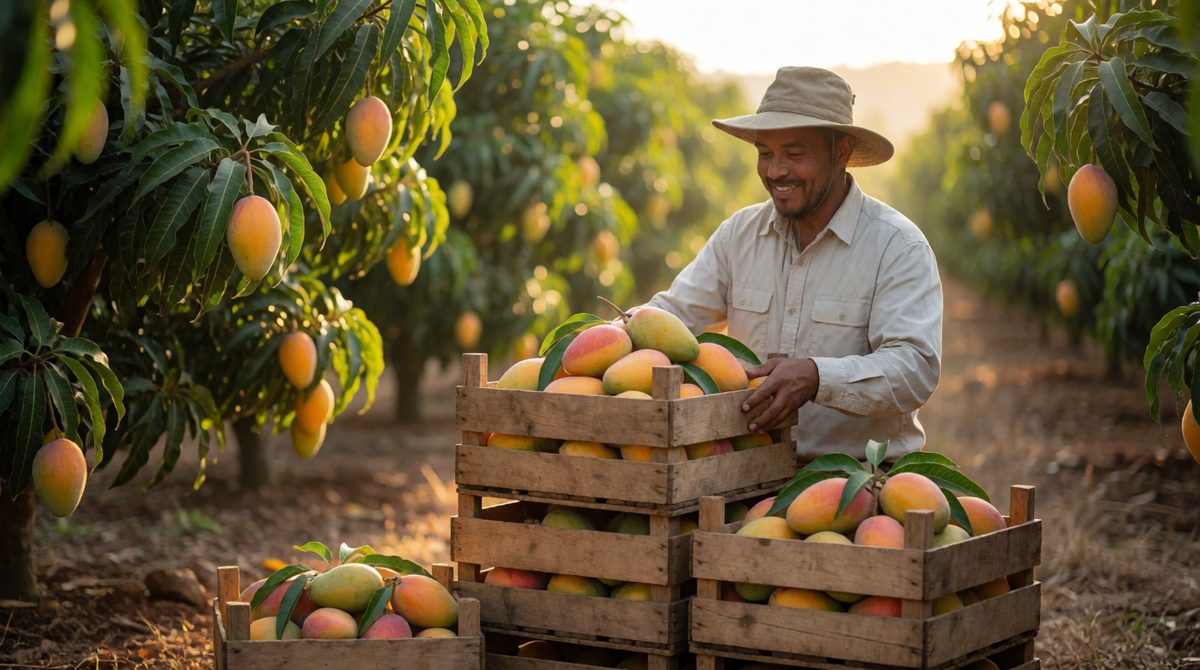
Crates piled high at harvest: the higher the price for mangoes, the more a farmer is willing and able to pick and sell
The last two lessons looked at the buyers' side of a market. Now we turn to the sellers. Think of a farmer who grows mangoes. At $4 a crate she may not think it is worth the effort of picking and selling them. At $12 a crate she will happily sell as many as she can. Economists use the word supply to describe this link between price and selling.
Key terms:
Just like demand, the definition of supply has three parts, and all of them matter.
The producer is prepared to sell the good at that price.
The producer has the resources and the means to make the good and bring it to the market.
Supply is always for a time, such as per day, per week or per year.
Supply is also linked to a price. Saying "I supply 10 crates" is not enough. Saying "I would supply 10 crates a week at $10 a crate" is supply.
A supply schedule lists each price and the quantity a producer is willing and able to sell at that price. Here is the weekly supply of Rosa, a mango farmer in the made-up country of Tandor.
| Price per crate ($) | Rosa's quantity supplied per week (crates) |
|---|---|
| 4 | 0 |
| 6 | 2 |
| 8 | 4 |
| 10 | 6 |
| 12 | 8 |
As the price goes up, Rosa supplies more. This is individual supply, because it covers only one producer. At $4 she supplies none, because that price is too low to make selling worthwhile.
A market has many sellers, not just one. To find market supply, add up the individual supplies of all the firms at each price. Here are three mango farmers in Tandor.
| Price ($) | Rosa | Dev | Hana | Market supply |
|---|---|---|---|---|
| 4 | 0 | 0 | 2 | 2 |
| 6 | 2 | 1 | 4 | 7 |
| 8 | 4 | 3 | 6 | 13 |
| 10 | 6 | 5 | 8 | 19 |
| 12 | 8 | 7 | 10 | 25 |
Read across each row. At $8 the market supply is 4 + 3 + 6 = 13 crates a week. Notice that Dev supplies nothing at $4 but Hana does. Different firms have different costs and different resources, so they are not all willing to sell at the same price.
The supply curve is drawn from the market supply column. In the exam, follow these steps.
Use the market supply table above. How many crates are supplied when the price is $10? Find $10 on the vertical axis, move across to the supply curve S, then go straight down to the quantity axis. The market supply is 19 crates a week. Reading the other way, to get 13 crates supplied each week the price must be $8.
The curve slopes upward from left to right. This shows that a higher price leads to a higher quantity supplied, and a lower price leads to a lower quantity supplied. It is the opposite of the demand curve, which slopes downward.

A busy production line pays off when prices rise - higher prices make making more profitable, so supply slopes upward
Remember, profit is what is left of a firm's revenue after its costs are paid. There are two main reasons why more is supplied when the price rises.
A higher price means more revenue from each unit sold, while costs stay much the same. Selling the good becomes more profitable, so firms want to produce and sell more of it.
High prices and the chance of profit attract new firms. Each new firm adds its own supply, so the quantity supplied in the market grows.
When the price is low, the opposite happens. Production is less profitable, some firms cut back or leave, and the quantity supplied falls.
1. Leaving out willingness or ability when defining supply, or forgetting the time period. 2. Putting Price on the horizontal axis. Price goes on the vertical axis. 3. Adding prices together to find market supply. You add the quantities at each price, never the prices. 4. Drawing a supply curve that slopes downward. 5. Mixing up the labels. The supply curve is S, not D. 6. Not labelling the axes or the curve.
Soap is made by small firms in the town of Merrin, in the made-up country of Verdell. The table shows the weekly supply of bars of soap from two firms, Lio's Soaps and Nia's Soaps.
| Price per bar ($) | Lio's Soaps | Nia's Soaps |
|---|---|---|
| 2 | 10 | 0 |
| 4 | 20 | 10 |
| 6 | 30 | 20 |
(a) Define supply. [2 marks]
(b) Calculate the market supply of soap at $2 and at $6, assuming the two firms are the only producers. [2 marks]
(c) Explain why the supply curve for soap slopes upward. [4 marks]
(a) Supply is the willingness and ability of producers to sell a good at a given price (1) over a period of time (1).
(b) At $2: 10 + 0 = 10 bars (1). At $6: 30 + 20 = 50 bars (1).
(c) A higher price makes selling soap more profitable (1), so existing firms are willing to produce and supply more (1). The chance of profit also attracts new firms into the market (1). Each new firm adds to market supply, so the quantity supplied rises as the price rises (1).
In part (b), show the addition, such as 30 + 20 = 50, and add the quantities, not the prices. In part (c), name the reason (profit, new firms) and then link it to the quantity supplied. Do not just say that the curve slopes up.