👷 Costs of production
Costs include wages and the price of raw materials. If costs fall, production is more profitable, so supply increases. If costs rise, supply decreases. A rise in the wages of a clothing factory's workers is a cost rise.
Sign up to access the complete lesson and track your progress!
Unlock This Course
Rows of busy sewing machines: if this factory's wages or material costs change, the whole supply curve shifts
Last lesson you drew a supply curve. It shows what producers plan to sell at each price over a given period, such as one week. But producers' plans can change in two different ways, and the exam expects you to name them correctly. A made-up firm in the country of Beltara makes phone cases. Here is its supply schedule.
| Price per case ($) | Quantity supplied per week |
|---|---|
| 2 | 20 |
| 4 | 40 |
| 6 | 60 |
| 8 | 80 |
| 10 | 100 |
Two very different things might happen:
In the first case, the firm has reacted to a new price. In the second, something else has changed its plans.
Key terms:
There is only one cause of an extension or a contraction: a change in the price of the good itself. Nothing else moves you along the curve.
Back to Beltara. When the price rises from $6 to $8, the quantity supplied rises from 60 to 80. That is an extension. If the price falls from $8 back to $6, the quantity supplied falls from 80 to 60. That is a contraction.
In the exam, to draw a movement along a supply curve:
There is only one curve in this diagram. The curve itself does not move.
When something other than the good's own price changes, producers plan to supply a different quantity at every price. That moves the whole curve.
In the exam, to draw a shift:
The faster machine in Beltara moves the curve to the right. At $6 the quantity supplied rises from 60 to 90 cases, and more is supplied at every other price too.
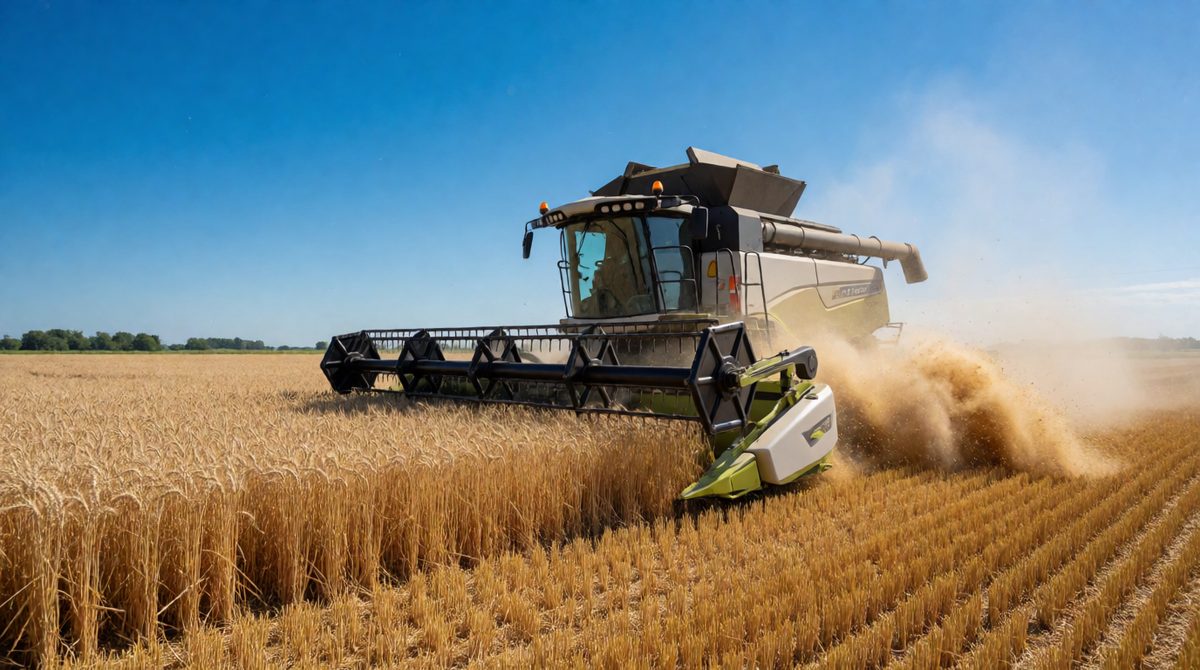
New technology like this harvester lets farmers grow more at every price - that's an increase in supply, a shift to the right
Costs include wages and the price of raw materials. If costs fall, production is more profitable, so supply increases. If costs rise, supply decreases. A rise in the wages of a clothing factory's workers is a cost rise.
Better machines and methods let firms make more output from the same resources, often at a lower cost. Supply increases.
An indirect tax, such as a tax on each unit sold, raises a firm's costs, so supply decreases. A subsidy is money paid to producers. It lowers their costs, so supply increases. You will study these as government policy later.
Good weather can give a big harvest, so the supply of crops increases. Drought, floods and storms can destroy crops or damage factories, so supply decreases.
More firms in the market means more is supplied at every price, so market supply increases. If firms leave, market supply decreases.
A firm can often make a different good with the same resources. A made-up factory that can make bicycles or scooters will switch to scooters if the price of scooters rises. The supply of bicycles decreases.
Many students lose marks by mixing up the four words. Use this table.
| What happens | Cause | Name | On the diagram |
|---|---|---|---|
| Quantity supplied rises | The good's own price rises | Extension | Move up along the same curve |
| Quantity supplied falls | The good's own price falls | Contraction | Move down along the same curve |
| Supply rises at every price | Lower costs, technology, subsidy, good weather, more firms | Increase | Curve shifts right |
| Supply falls at every price | Higher costs, indirect tax, bad weather, fewer firms | Decrease | Curve shifts left |
Remember, the demand curve moves in the same two ways, with the same four words, but the causes are different.
A made-up farm in Selmar grows rice. A flood destroys part of the crop, so the farm can supply less rice at every price. Step 1: the cause is a natural event, not the price of rice. Step 2: so this is a shift, not a movement. Step 3: less is supplied at every price, so it is a decrease in supply, and S1 shifts left to S2.
1. Saying a rise in price causes an "increase in supply". It causes an extension in supply. 2. Shifting the curve when only the good's own price has changed. 3. Shifting the curve the wrong way: lower costs move it right, higher costs move it left. 4. Forgetting to label the axes or the curves S1 and S2.
In the made-up country of Kovia, many farmers grow wheat. This year a drought reduces the harvest. At the same time, the price of fertiliser, which farmers use to grow wheat, falls. The price of wheat itself stays the same.
(a) State two factors, other than the price of wheat, that can change the supply of wheat. [2 marks]
(b) Explain why the fall in the price of fertiliser may increase the supply of wheat. [3 marks]
(c) Analyse, using a supply diagram, the effect of the drought on the supply of wheat. [5 marks]
(a) Any two from: costs of production, such as wages or raw materials (1); technology (1); indirect taxes or subsidies (1); weather and natural events (1); number of firms (1); prices of other goods the firm could make (1).
(b) Fertiliser is a cost of producing wheat (1). When it gets cheaper, the cost of production falls and growing wheat becomes more profitable (1). So farmers plan to supply more wheat at every price (1).
(c) The drought is a natural event that reduces the harvest (1). The price of wheat has not changed, so this is a shift of the curve, not a movement along it (1). Draw Price on the vertical axis and Quantity on the horizontal axis, with an upward-sloping curve S1 (1). Draw S2 to the left of S1 (1). This is a decrease in supply: less is supplied at every price (1).
In part (c), the price of wheat does not change. Say so clearly, then draw a new curve S2 to the left of S1. If you draw an arrow along S1, you lose marks.