💲 Equilibrium price
The one price where the quantity demanded and the quantity supplied are the same.
Sign up to access the complete lesson and track your progress!
Unlock This Course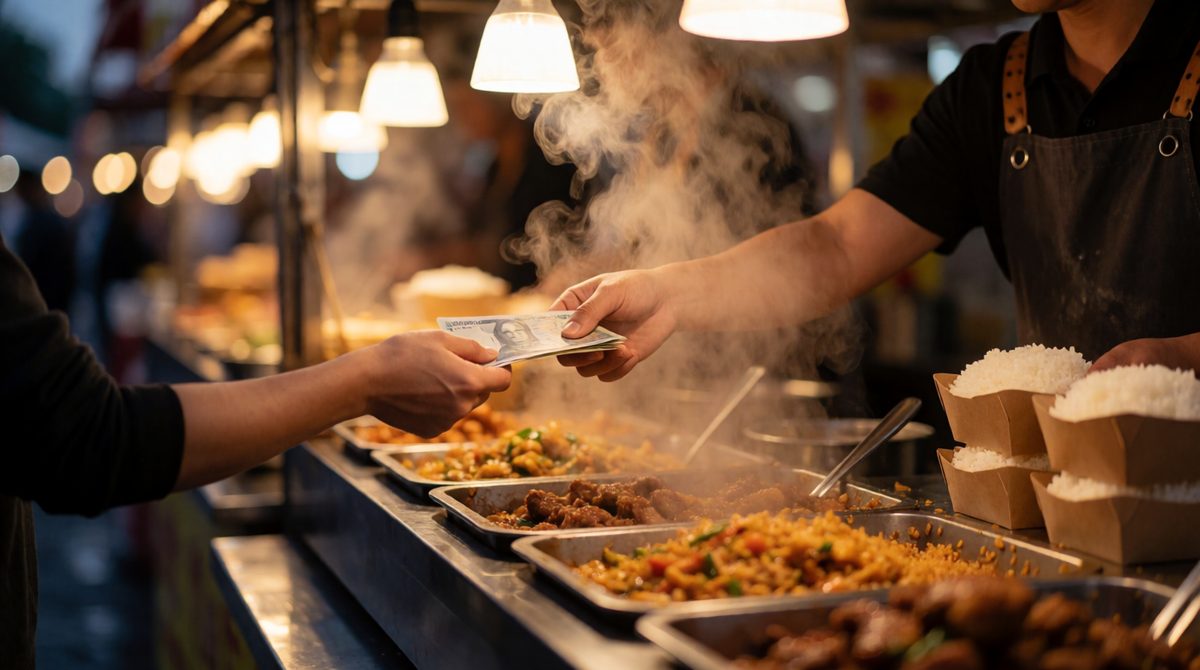
A deal is done: at the equilibrium price, the amount buyers want to buy matches what sellers want to sell
Buyers want low prices. Sellers want high prices. Yet in a working market, there is usually one price at which both sides are happy to trade. At that price, the quantity buyers want to buy is exactly the quantity sellers want to sell.
In The Price Mechanism you saw how prices steer resources. This lesson shows the price that demand and supply settle on.
Key terms:
Equilibrium means a state of balance. Think of a seesaw with two children of the same weight: nothing moves.
In a market, demand and supply are in balance when demand equals supply. Nobody has a reason to change what they are doing, so the price stays where it is. We say there is no tendency to change.
The one price where the quantity demanded and the quantity supplied are the same.
The amount of the good that is actually bought and sold at that price.
Each market has one equilibrium price and one equilibrium quantity at any moment.

At the right price every bottle on this stall finds a buyer - at equilibrium, quantity demanded equals quantity supplied
You can find equilibrium from a demand and supply schedule. Here is the made-up market for reusable water bottles in the country of Tolmar.
| Price per bottle ($) | Quantity demanded (thousands a month) | Quantity supplied (thousands a month) |
|---|---|---|
| 2 | 100 | 20 |
| 4 | 80 | 40 |
| 6 | 60 | 60 |
| 8 | 40 | 80 |
| 10 | 20 | 100 |
Follow these steps.
Here both columns show 60 at a price of $6. So the equilibrium price is $6 and the equilibrium quantity is 60 thousand bottles a month.
At every other price the two columns show different numbers, so the market is not in balance there. What happens at those prices is the topic of Disequilibrium: Shortages and Surpluses.
The table shows the market for concert tickets in the made-up city of Brenmoor.
| Price ($) | Quantity demanded | Quantity supplied |
|---|---|---|
| 5 | 800 | 150 |
| 10 | 650 | 300 |
| 15 | 500 | 500 |
| 20 | 350 | 650 |
| 25 | 200 | 800 |
Demand equals supply at 500, in the $15 row. The equilibrium price is $15 and the equilibrium quantity is 500 tickets.
A diagram shows the same information with curves. In the exam, follow these steps.
The crossing point is the only place where demand and supply give the same quantity at the same price. That is why it is equilibrium.
Suppose the Tolmar diagram has its curves crossing at a price of $6 and a quantity of 60 thousand. Then P is $6 and Q is 60 thousand.
Look back at the schedule. The 60 and 60 in the $6 row are the crossing point of the two curves. The schedule and the diagram tell the same story.
Rice boxes are sold from street stalls in the made-up town of Dalmoor. The table shows the daily market for rice boxes.
| Price per box ($) | Quantity demanded | Quantity supplied |
|---|---|---|
| 3 | 400 | 100 |
| 4 | 340 | 190 |
| 5 | 280 | 280 |
| 6 | 220 | 370 |
| 7 | 160 | 460 |
(a) Define market equilibrium. [2 marks]
(b) Identify the equilibrium price and the equilibrium quantity. [2 marks]
(c) Describe how you would show this equilibrium on a demand and supply diagram. [4 marks]
(a) Market equilibrium is where demand equals supply (1), so there is no tendency for the price or quantity to change (1).
(b) The equilibrium price is $5 (1) and the equilibrium quantity is 280 boxes (1).
(c) Draw price on the vertical axis and quantity on the horizontal axis (1). Draw a downward sloping demand curve labelled D and an upward sloping supply curve labelled S (1). Mark the point where they cross (1). Draw dotted lines from this point to the axes to show the equilibrium price of $5 and the equilibrium quantity of 280 (1).
For "Identify" questions, give the unit and both values: the price with its $ sign and the quantity with what is being counted.