📏 Perfectly inelastic
Draw a straight vertical line up from the quantity axis and label it S. When the price rises from P1 to P2, quantity stays at Q1.
Sign up to access the complete lesson and track your progress!
Unlock This Course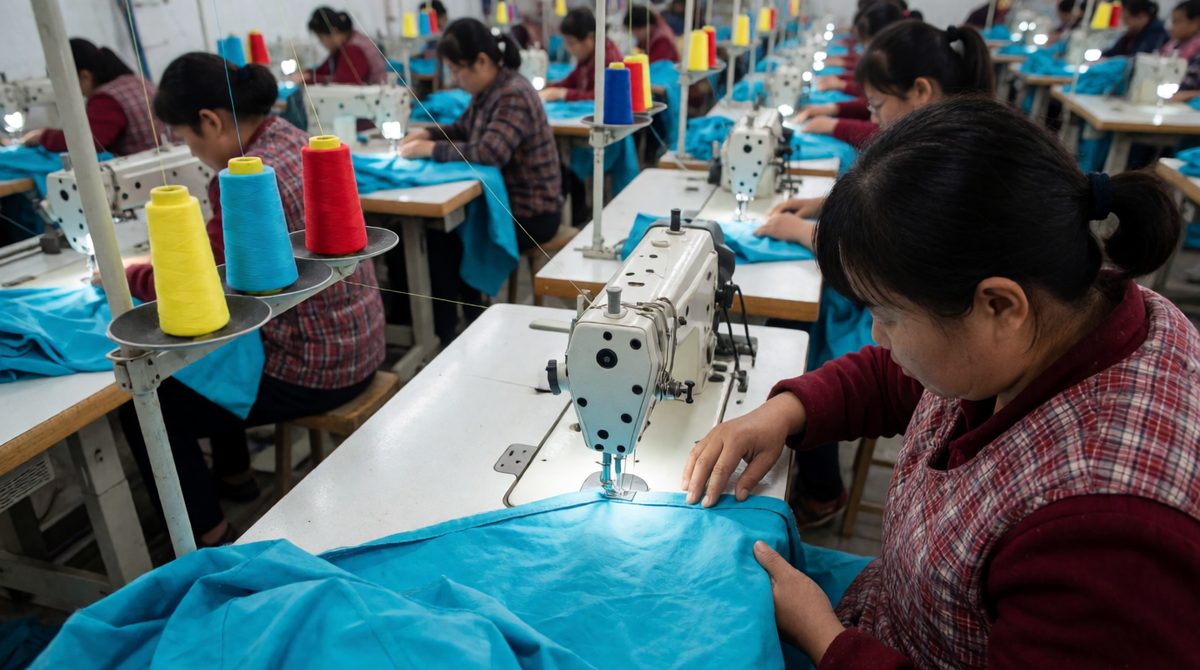
Clothes on a production line can be made faster when prices rise - PES measures how much quantity supplied responds to a price change
Demand elasticity asks how buyers react to a price change. Now we look at the other side of the market: how do producers react when the price changes? When the price of a good rises, firms want to supply more. Some can do it quickly. Others cannot.
Key terms:
The method mirrors PED from the earlier lessons, so we keep the calculation short here.
PES = percentage change in quantity supplied ÷ percentage change in price
Because a price rise leads to a rise in quantity supplied, the answer is normally positive. This is different from PED, which is normally negative.
The price of coffee in the made-up country of Kandara rises from $4 to $5 per kg. Quantity supplied rises from 800 kg to 880 kg a week.
Price: 1 ÷ 4 × 100 = +25%.
Quantity: 80 ÷ 800 × 100 = +10%.
PES: 10 ÷ 25 = 0.4. Supply is inelastic.
A bakery in Lorvik raises its output of loaves when the price rises from $2.00 to $2.20. Quantity supplied rises from 500 to 600 loaves a day.
Price: 0.20 ÷ 2.00 × 100 = +10%.
Quantity: 100 ÷ 500 × 100 = +20%.
PES: 20 ÷ 10 = 2. Supply is elastic.
The words elastic, inelastic and unitary mean the same here as they did for demand. The table shows the five cases and the supply curve for each.
| Type of supply | PES value | Supply curve | What it shows |
|---|---|---|---|
| Perfectly inelastic | 0 | A vertical straight line | Quantity supplied does not change at all when price changes |
| Inelastic | Between 0 and 1 | A steep upward-sloping curve | Quantity supplied changes by a smaller percentage than price |
| Unitary | Exactly 1 | A straight line through the origin | Quantity supplied changes by the same percentage as price |
| Elastic | Greater than 1 | A shallow upward-sloping curve | Quantity supplied changes by a larger percentage than price |
| Perfectly elastic | Infinity | A horizontal straight line | Producers will supply any amount at one price, and none below it |
For every diagram, put Price on the vertical axis and Quantity on the horizontal axis. Label the curve S.
Draw a straight vertical line up from the quantity axis and label it S. When the price rises from P1 to P2, quantity stays at Q1.
Draw a straight horizontal line across from the price axis and label it S. At that price producers supply any quantity. Below it, quantity supplied falls to zero.
Draw a steep upward-sloping line that meets the quantity axis, or a steep curve. A price rise from P1 to P2 moves you up the curve, but quantity rises only a little, from Q1 to Q2.
Draw a shallow upward-sloping line that starts on the price axis. The same price rise causes a large rise in quantity, from Q1 to Q2.
Draw a straight upward-sloping line that starts exactly at the origin, where the two axes meet. Its steepness does not matter. What matters is that it passes through the origin.
A straight supply line that cuts the price axis is elastic. A straight supply line that cuts the quantity axis is inelastic. A straight line that goes through the origin is unitary. Do not judge by steepness alone when comparing lines that start in different places.
Key terms:
Supply is elastic when firms can raise output quickly and cheaply. It is inelastic when they cannot. Six influences decide which.
In the short run, firms cannot easily change their factories, land or equipment, so supply is more inelastic. Over a longer time they can build, train and expand, so supply becomes more elastic.
A firm with spare capacity can raise output quickly when the price rises, so supply is elastic. A firm already working at full capacity cannot produce more, so supply is inelastic.
A firm holding large stocks can release them straight away when the price rises, so supply is elastic. With no stocks, it must wait until it makes more, so supply is inelastic.
If workers, machines and materials can easily be moved from making one good to another, firms can respond quickly to a price change, so supply is elastic. If factors are specialised, such as a machine that can only make one product, supply is inelastic.

Fresh fish can't sit in a warehouse waiting for higher prices, so its supply is inelastic - perishable goods can't be stockpiled
Perishable goods, such as fresh fish or flowers, cannot be stored. Producers cannot hold stocks ready to release when the price rises, so supply is inelastic. Goods that can be stored easily, such as tinned food, have more elastic supply.
If a good can be made in hours, such as a cup of tea, supply is elastic. If it takes a long time, such as growing cocoa trees or building a ship, supply is inelastic, because output cannot rise quickly.
Mixing up the diagrams: demand curves slope down but supply curves slope up, so a supply curve for PES is never a downward-sloping line.
Saying a steep curve is always inelastic. Check where straight lines start, and remember that unitary means a straight line through the origin.
Forgetting that time matters. Always say whether you mean the short run or the long run, because supply is usually more elastic over a longer time.
Writing a negative PES. A normal supply curve gives a positive answer.
In the made-up country of Delmar, a farm grows fresh flowers and a workshop makes wooden chairs. The price of chairs rises from $50 to $60, and the quantity supplied rises from 200 to 210 a week.
(a) Define price elasticity of supply. [2 marks]
(b) Calculate the price elasticity of supply of chairs. Show your working. [2 marks]
(c) Explain why the supply of fresh flowers is likely to be inelastic in the short run. [4 marks]
(a) PES is a measure of how responsive (1) the quantity supplied of a good is to a change in its price (1).
(b) Price change = 10 ÷ 50 × 100 = 20%. Quantity change = 10 ÷ 200 × 100 = 5% (1). PES = 5 ÷ 20 = 0.25 (1).
(c) Fresh flowers are perishable (1), so growers cannot store them and release stocks when the price rises (1). Flowers also take time to grow (1), so in the short run output cannot be raised quickly even if the price goes up (1). So quantity supplied changes by a smaller percentage than price.
In part (c), give a reason and then say what it does to output. Use the words 'perishable' and 'short run' and link your answer back to PES.