Production Possibility Curves » Production Possibility Curves
What you'll learn this session
Study time: 30 minutes
Cambridge spec: 1.4.1, 1.4.2, 1.4.3
- Define a production possibility curve (PPC) and draw one from a table
- Explain what points under, on and beyond the curve mean
- Calculate opportunity cost when moving along a PPC
- Explain why a PPC is usually bowed out
🔒 Unlock Full Course Content
Sign up to access the complete lesson and track your progress!
Unlock This CourseWhat is a production possibility curve?
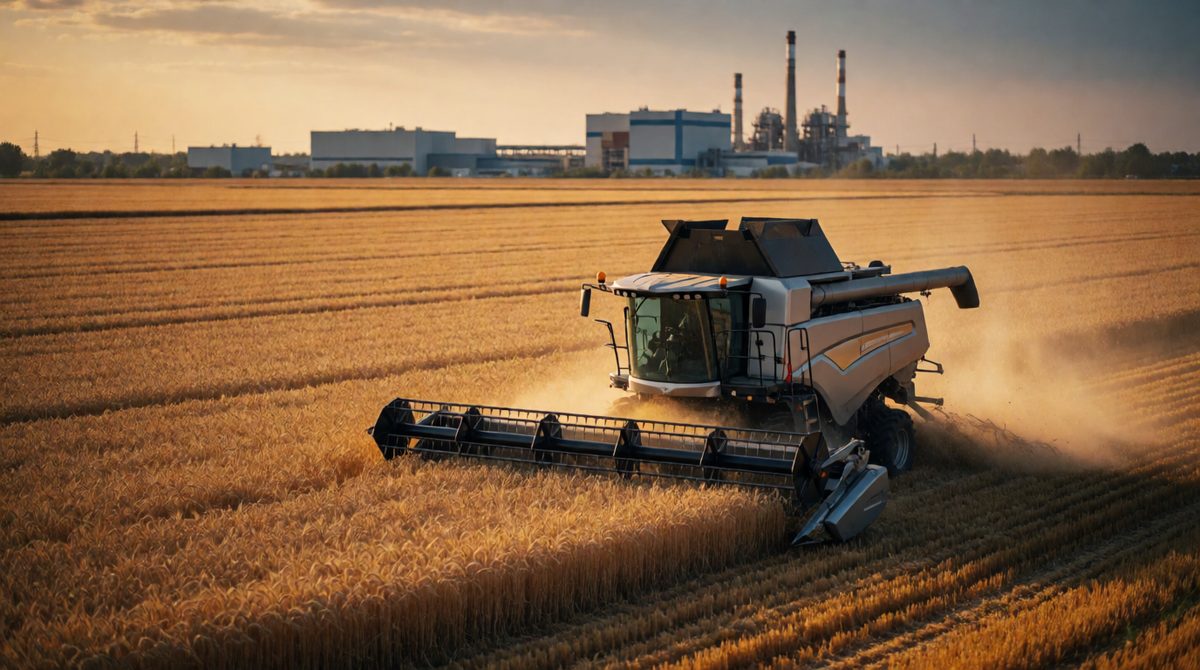
With scarce resources a country must choose how much food and how many machines to make
Resources are scarce, so an economy cannot make everything it wants. A country has to choose how to split its resources between different goods. A production possibility curve shows those choices on one diagram.
Key terms:
- Production possibility curve (PPC): a curve showing the maximum combinations of two goods that an economy can produce with all its resources, fully and efficiently used.
Every point on the curve is a combination of the two goods that the economy can make. To get more of one good, it must make less of the other. That trade-off is opportunity cost, which you met in the lesson on Opportunity Cost and Decision-Making.
Drawing a PPC from a table
The made-up country of Kellara makes only two goods: food and machines. This table shows the most it can make of one good for each amount of the other.
| Point | Machines (thousands) | Food (thousand tonnes) |
|---|---|---|
| A | 0 | 100 |
| B | 20 | 90 |
| C | 40 | 70 |
| D | 60 | 40 |
| E | 80 | 0 |
To draw it in an exam, follow these steps:
- Label the horizontal axis "Machines (thousands)" and the vertical axis "Food (thousand tonnes)".
- Mark each pair of figures from the table as a point, for example C at 40 on the horizontal axis and 70 on the vertical axis.
- Join the points with a smooth curve from A to E.
- Label the curve PPC.
The curve slopes downwards from left to right and bends outwards, away from the origin. It is bowed out.
Points under, on and beyond the curve
Idle machines mean the economy is producing inside its PPC, not on it
Where a production point sits, compared with the PPC, tells you something about the economy.
✅ On the curve
Resources are fully and efficiently used. Kellara at point C makes 40 thousand machines and 70 thousand tonnes of food. It cannot make more of one good without making less of the other.
📉 Under the curve
Resources are unemployed or used inefficiently. Suppose Kellara makes 40 thousand machines and 40 thousand tonnes of food. It could make 70 thousand tonnes at that level of machines, so it is wasting resources.
❌ Beyond the curve
This is unattainable. Kellara cannot make 60 thousand machines and 60 thousand tonnes of food, because its resources only allow 40 thousand tonnes of food with 60 thousand machines.
Moving from a point under the curve up to the curve is different from moving along it. If workers who had no jobs are given work, Kellara can have more of one good, or both, without giving up anything. The economy has simply stopped wasting resources.
Movements along a PPC and opportunity cost
When an economy is already on its PPC, moving to another point on the curve means giving up some of one good to gain more of the other. The amount given up is the opportunity cost. You can calculate it from the table.
Worked example
Kellara moves from point C to point D. Machines rise from 40 to 60 thousand, a gain of 20 thousand. Food falls from 70 to 40 thousand tonnes, a loss of 30 thousand tonnes. The opportunity cost of the extra 20 thousand machines is 30 thousand tonnes of food. For each machine, that is 30 ÷ 20 = 1.5 tonnes of food.
The same movement works in the other direction. Moving from D back to C, Kellara gains 30 thousand tonnes of food and gives up 20 thousand machines. So the opportunity cost of those 30 thousand tonnes of food is 20 thousand machines.
Now compare the other moves in the table. Each time Kellara gains 20 thousand machines, it gives up more food:
| Move | Machines gained | Food given up |
|---|---|---|
| A to B | 20 thousand | 10 thousand tonnes |
| B to C | 20 thousand | 20 thousand tonnes |
| C to D | 20 thousand | 30 thousand tonnes |
| D to E | 20 thousand | 40 thousand tonnes |
The opportunity cost of machines keeps rising. This is called increasing opportunity cost.
Why is the curve bowed out?
A PPC is usually bowed out because resources are not equally suited to making both goods. Think of Kellara's workers and land.
- At point A, everything goes into food. To start making machines, Kellara moves the workers and land that are best at making machines and worst at growing food. Very little food is lost.
- As more machines are made, Kellara has to use workers and land that are very good at growing food but poor at making machines. Each extra machine now costs much more food.
So the more of one good an economy makes, the more of the other good it has to give up for each extra unit. That gives the bowed out shape.
A PPC is a straight line when the opportunity cost is constant. This happens when resources are equally suited to both goods, so moving them costs the same each time.
| Rice (thousand tonnes) | Wheat (thousand tonnes) |
|---|---|
| 0 | 80 |
| 10 | 60 |
| 20 | 40 |
| 30 | 20 |
| 40 | 0 |
In this made-up table, every extra 10 thousand tonnes of rice costs 20 thousand tonnes of wheat. The opportunity cost is the same each time, so the PPC is a straight line.
Common mistakes
1. Calling a point under the curve unattainable. It can be reached. It just wastes resources. Only points beyond the curve are unattainable.
2. Forgetting that moving along the curve costs something. On the PPC, more of one good always means less of the other.
3. Mixing up the axes. Always read the opportunity cost from the good that falls, not the good that rises.
4. Drawing a straight line by default. Draw a bowed out curve unless the question says the opportunity cost is constant.
Exam-style question
The made-up country of Menoria produces only rice and tea. Its production possibilities are shown in the table.
| Point | Tea (thousand tonnes) | Rice (thousand tonnes) |
|---|---|---|
| A | 0 | 60 |
| B | 10 | 55 |
| C | 20 | 45 |
| D | 30 | 30 |
| E | 40 | 10 |
(a) Define a production possibility curve. [2 marks]
(b) Calculate the opportunity cost, in rice, of moving from point B to point D. [2 marks]
(c) Explain why Menoria cannot produce 50 thousand tonnes of rice and 30 thousand tonnes of tea. [4 marks]
Model answer
(a) A curve showing the maximum combinations of two goods (1) that an economy can produce with its resources fully and efficiently used (1).
(b) Rice falls from 55 to 30 thousand tonnes (1). The opportunity cost is 25 thousand tonnes of rice (1).
(c) With 30 thousand tonnes of tea, the most rice Menoria can make is 30 thousand tonnes (1). So 50 thousand tonnes of rice with 30 thousand tonnes of tea lies beyond the PPC (1). It would need more resources than Menoria has (1). It is therefore unattainable with current resources (1).
Exam tip
In a calculation, show the two figures you subtract and give the units. Writing "25" alone can lose the second mark.