🌿 Introduction to Food Chains and Ecosystems
Every living thing needs energy to survive. Plants get theirs from the sun. Animals get theirs by eating other things. A food chain shows this simple idea who eats who in a straight line. It's one of the most important ideas in Environmental Management and once you get it, everything else about ecosystems starts to make sense.
An ecosystem is a community of living organisms (plants, animals, bacteria) interacting with each other and their non-living environment (soil, water, sunlight). Food chains and food webs show us the feeding relationships inside that community.
Key Definitions:
- Food Chain: A sequence showing how energy passes from one organism to the next through feeding.
- Food Web: A network of interconnected food chains within an ecosystem.
- Trophic Level: The position an organism occupies in a food chain based on what it eats.
- Producer: An organism (usually a plant) that makes its own food using sunlight through photosynthesis.
- Consumer: An organism that gets energy by eating other organisms.
- Decomposer: An organism (like bacteria or fungi) that breaks down dead material, returning nutrients to the soil.
- Biomass: The total mass of living material at a trophic level, usually measured in grams per square metre.
☀ How a Food Chain Works
A food chain always starts with a producer something that can make its own food. Arrows show the direction energy travels. So grass → rabbit → fox means the rabbit eats the grass and the fox eats the rabbit. The arrow means "is eaten by" or "energy flows to."
Simple, right? But nature is never quite that tidy which is why we also use food webs.
🌎 Where Does the Energy Come From?
Almost all energy in an ecosystem comes from the Sun. Plants capture solar energy through photosynthesis and store it as chemical energy in their leaves, stems and roots. When an animal eats a plant, it gets some of that stored energy. When another animal eats that animal, it gets some energy too but less each time.
🌿 Trophic Levels Explained
Think of trophic levels like floors in a building. Each floor represents a feeding level. The ground floor is always the producers. As you go up, you move through different types of consumers. Most ecosystems only have 4 or 5 floors because energy is lost at every level and there simply isn't enough left to support more.
The Trophic Level Floors 🏢
Here's how the levels break down. Every organism in an ecosystem fits into one of these categories:
🌿 Level 1 Producers
Plants, algae and phytoplankton. They use sunlight to make food via photosynthesis. Examples: grass, oak trees, seaweed, wheat.
They form the base of every food chain. No producers = no ecosystem.
🐇 Level 2 Primary Consumers
Herbivores that eat producers directly. Examples: rabbits, caterpillars, zebras, aphids, cows.
They are also called first-order consumers. They get the most energy from the chain after the producers.
🦊 Level 3 Secondary Consumers
Carnivores or omnivores that eat primary consumers. Examples: foxes, frogs, lions, thrushes.
They are second-order consumers. Energy available to them is already much reduced.
🦅 Level 4 Tertiary Consumers
Top predators that eat secondary consumers. Examples: eagles, sharks, killer whales, tigers. These are often called apex predators nothing eats them (except decomposers when they die).
🍃 Level 5 Decomposers
Bacteria and fungi that break down dead organisms at every level. They release nutrients back into the soil, which producers then use. Without decomposers, nutrients would be locked in dead matter forever.
💡 Quick Fact The 10% Rule
On average, only about 10% of energy is passed on from one trophic level to the next. The other 90% is lost mostly as heat during respiration and some in waste products. This is why food chains rarely have more than 5 levels. By the time you reach the top predator, there's very little energy left to go around. It also explains why there are always far fewer top predators than there are plants!
🌎 Food Webs The Real Picture
A food chain is a useful starting point, but it's a massive simplification. In reality, most animals eat more than one thing and most organisms are eaten by more than one predator. A food web shows all these connections at once, giving us a much more accurate picture of how energy flows through an ecosystem.
Food webs are important because they show us stability. If one species disappears from a food web, other species can often compensate. But if a key species (called a keystone species) is removed, the whole web can collapse.
🌎 Case Study: The Serengeti Food Web, Tanzania
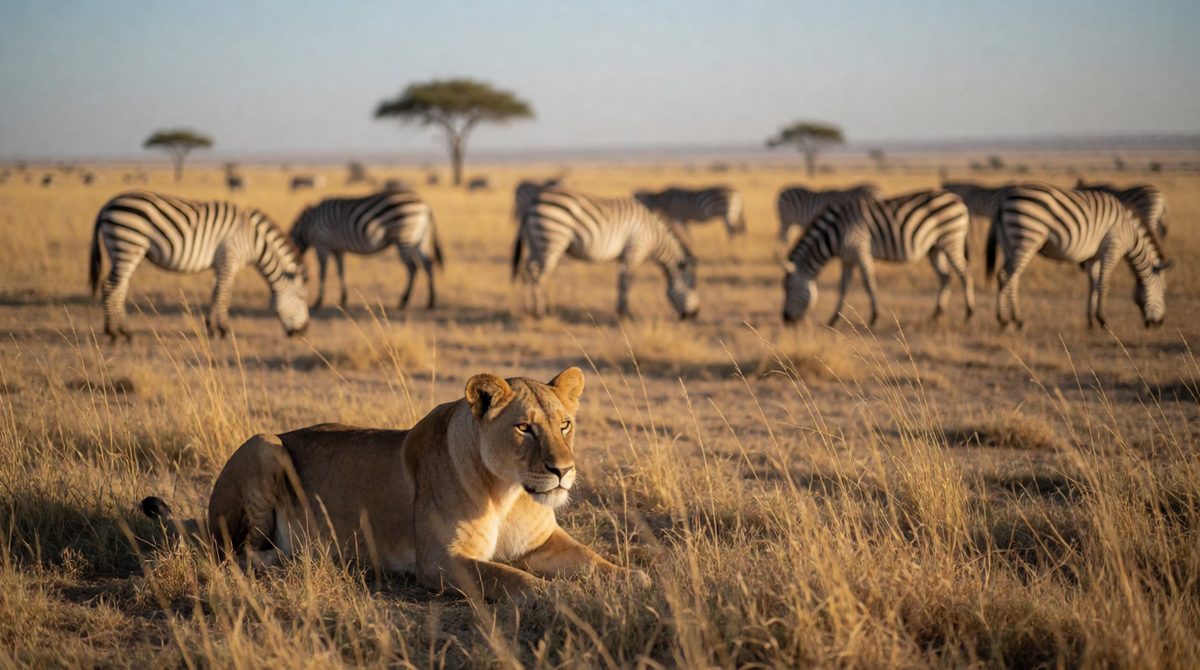
Predators and prey are linked in the Serengeti food web
The Serengeti in East Africa is one of the most studied ecosystems on Earth. It has an incredibly complex food web involving dozens of species across multiple trophic levels.
🌿 Producers
Savanna grasses (e.g. Themeda triandra), acacia trees, shrubs. These support the enormous herds of herbivores the Serengeti is famous for.
🐇 Primary Consumers
Wildebeest (over 1.5 million!), zebras, gazelles, elephants, buffalo. All herbivores feeding directly on the grasses and plants.
🦊 Secondary & Tertiary Consumers
Lions, cheetahs, leopards, hyenas, wild dogs, crocodiles. These predators keep herbivore populations in check, preventing overgrazing.
The Serengeti shows perfectly why food webs matter. When rinderpest disease wiped out most wildebeest in the early 20th century, grass grew unchecked, leading to more frequent fires. When wildebeest numbers recovered after vaccination programmes in the 1960s, the ecosystem bounced back. One species the wildebeest had a massive knock-on effect on the entire web.
🌿 Case Study: UK Woodland Food Web
A typical British oak woodland has a rich food web. Oak trees (producers) support caterpillars and aphids (primary consumers). Blue tits and great tits eat the caterpillars (secondary consumers). Sparrowhawks eat the blue tits (tertiary consumers). Foxes and tawny owls may also act as top predators. Earthworms, fungi and bacteria decompose fallen leaves and dead animals, returning nutrients to the soil for the oak trees to use again. Remove the oak tree and the whole web falls apart.
⚡ Energy Flow and the Pyramid of Numbers/Biomass
To understand how energy moves through a food web, scientists use ecological pyramids. These diagrams show how the amount of organisms, energy, or biomass changes at each trophic level.
📈 Pyramid of Numbers
Shows the number of organisms at each trophic level. Usually widest at the bottom (lots of plants) and narrowest at the top (few top predators). However, it can be inverted one oak tree supports thousands of caterpillars, making the producer level appear smaller.
📈 Pyramid of Biomass
Shows the total mass of living material at each level. This is almost always a true pyramid shape there is always more biomass at the producer level than at any consumer level. This is because energy is lost at each stage, so less biomass can be supported higher up.
⚠ Human Impacts on Food Webs
Human activity can seriously disrupt food chains and webs. When we remove one part of the web through hunting, habitat destruction, or pollution the effects ripple outwards in ways that are hard to predict.
- Overfishing: Removing too many cod from the North Sea has allowed populations of their prey (sand eels and shrimp) to explode, while seabirds that also rely on sand eels have declined.
- Pesticides: DDT was sprayed on crops to kill insects. But it built up in food chains (a process called bioaccumulation), reaching toxic levels in top predators like peregrine falcons, causing their eggshells to thin and populations to crash.
- Deforestation: Removing trees destroys the producer base of woodland food webs, causing knock-on collapses across all trophic levels.
- Invasive species: The introduction of the Nile Perch to Lake Victoria in Africa caused the extinction of over 200 native fish species, completely restructuring the lake's food web.
💡 Bioaccumulation A Scary Chain Reaction
Bioaccumulation (also called biomagnification) happens when a toxic substance like a pesticide or heavy metal is present in small amounts at the producer level but becomes more and more concentrated as it moves up the food chain. A tiny amount in plankton becomes a huge amount in a shark or eagle. This is why top predators are often most at risk from pollution, even if the pollution source seems far away from them.
📚 Exam Tips and Key Points to Remember
- ✅ Arrows in a food chain show the direction of energy flow, not "what eats what."
- ✅ Always start a food chain with a producer (a plant or photosynthetic organism).
- ✅ Only about 10% of energy transfers between trophic levels the rest is lost as heat.
- ✅ Food webs are more realistic than food chains because most animals eat multiple things.
- ✅ Removing a species from a food web causes knock-on effects always explain these in exam answers.
- ✅ Decomposers are part of every food web don't forget them!
- ✅ Pyramids of biomass are almost always true pyramid shapes pyramids of numbers can be inverted.
- ✅ Learn specific examples: Serengeti, UK woodland, Lake Victoria, North Sea cod.