🔎 Introduction to The Scientific Method in Fieldwork
Imagine you're standing by a river and you notice the water looks murkier near a farm than it does upstream. You wonder is the farm causing pollution? That question is the spark that starts a fieldwork investigation. The scientific method is the step-by-step process scientists (and GCSE students!) use to answer questions like this in a fair, reliable way.
In iGCSE Environmental Management, fieldwork investigations are a huge part of understanding the real world. Rather than just reading about deforestation or river pollution in a textbook, you go out, observe, measure and draw your own conclusions. The scientific method makes sure your conclusions are based on evidence not just guesswork.
Key Definitions:
- Scientific Method: A structured process for investigating questions by making observations, forming a hypothesis, collecting data and drawing conclusions.
- Fieldwork: Practical investigation carried out in a real environment outside the classroom.
- Hypothesis: A testable prediction or statement about what you expect to find, written before you collect any data.
- Variable: Any factor that can change during an investigation (e.g. temperature, pH, species count).
- Data: Information collected during an investigation, which can be numbers (quantitative) or descriptions (qualitative).
- Reliability: How consistent your results are if you repeated the investigation, would you get similar results?
- Validity: Whether your investigation actually measures what it claims to measure.
📈 Quantitative Data
This is data in the form of numbers. For example, measuring the pH of river water at five different points, counting the number of plant species in a quadrat, or recording temperature in °C. Quantitative data is easy to compare and put into graphs.
📝 Qualitative Data
This is data in the form of descriptions or observations. For example, describing the colour of river water, noting whether litter is present, or recording the general condition of a habitat. Qualitative data gives context that numbers alone can't provide.
📄 The Steps of the Scientific Method
The scientific method isn't just one thing it's a series of steps that build on each other. Miss a step and your whole investigation could fall apart. Here's how it works in environmental fieldwork:
① Step 1 Make an Observation
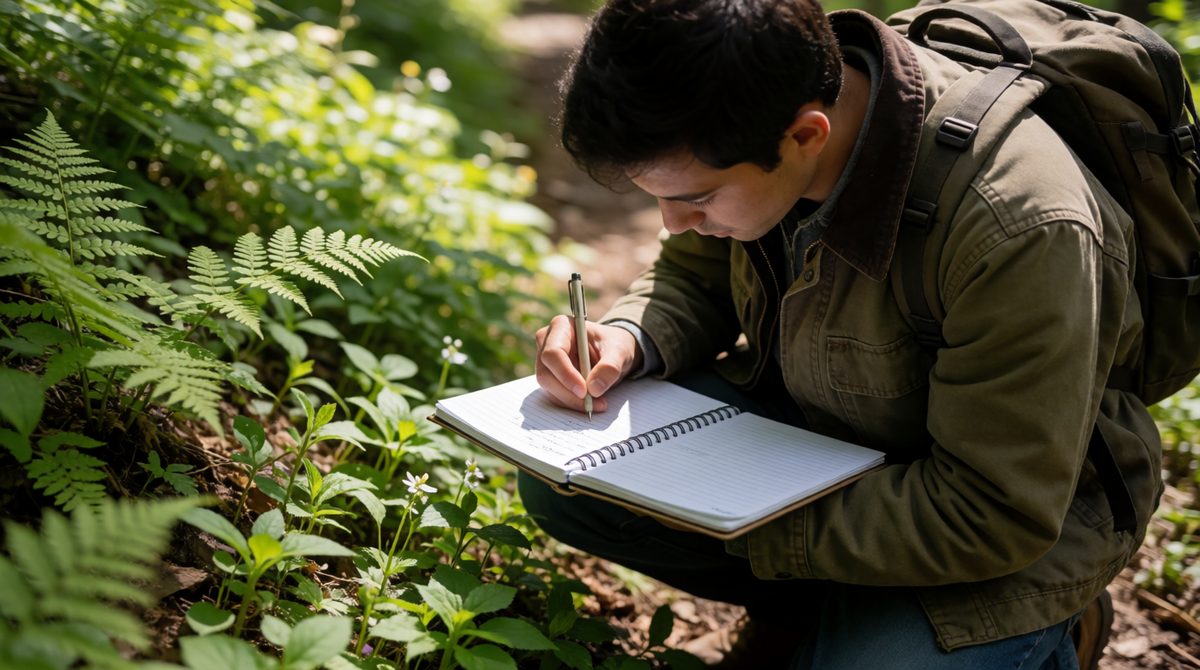
Fieldwork starts with careful observation
Every investigation starts with noticing something interesting or unusual in the environment. This could be something you see on a field trip, read about in the news, or spot on a map. Good observations lead to good questions.
💡 Example Observation
A student visits a local woodland and notices that there are far fewer wildflowers growing near the path than deeper into the wood. This observation leads to the question: "Does footpath trampling reduce plant biodiversity?"
② Step 2 Ask a Question
Turn your observation into a clear, focused question. A good fieldwork question is specific, measurable and relevant to the environment you're studying. Vague questions lead to vague investigations.
- ❌ Bad question: "Is the river dirty?"
- ✅ Good question: "Does the pH of the River Cam change as you move downstream from the town centre?"
③ Step 3 Form a Hypothesis
A hypothesis is your educated prediction about what you think will happen. It must be written before you collect data and it must be something you can actually test. A good hypothesis follows the format: "I predict that... because..."
💡 Hypothesis Example
"I predict that the pH of the river will decrease (become more acidic) as it moves downstream through the town, because industrial and agricultural runoff adds acidic pollutants to the water."
This is testable, specific and based on geographical reasoning exactly what examiners want to see!
④ Step 4 Plan the Investigation
Before you head into the field, you need a solid plan. This includes deciding what you'll measure, how you'll measure it, where you'll take samples and how many samples you'll take. Planning also means thinking about safety and ethics especially important in environmental fieldwork.
📍 Where to Sample
Choose sample sites that are representative of the area. Use random sampling to avoid bias for example, using a random number generator to pick quadrat locations in a field.
🔨 Equipment Needed
Match your equipment to your variables. pH meters for water quality, quadrats for plant surveys, clinometers for slope angles, flow meters for river speed. Always calibrate equipment before use.
⚠️ Risk Assessment
Identify hazards before fieldwork slippery riverbanks, traffic near roads, sun exposure. Write a simple risk assessment listing each hazard and how you'll reduce the risk.
⑤ Step 5 Collect Data
This is the exciting part actually going out and gathering your evidence! Good data collection means being systematic (following your plan), accurate (measuring carefully) and consistent (doing things the same way each time).
Always record data straight away in a field notebook or data table never rely on memory. Take repeat measurements where possible to check for errors.
🌎 Case Study: River Pollution Investigation River Wandle, London
Students investigating water quality along the River Wandle in South London collected data at six sites from source to mouth. At each site they recorded: water pH, turbidity (cloudiness), dissolved oxygen levels and the presence of indicator species (invertebrates that only survive in clean water). They used a tally chart to record species found in kick samples. By comparing upstream and downstream results, they could identify where pollution entered the river pinpointing a drainage outlet near an industrial estate as the main source.
⑥ Step 6 Record and Present Data
Raw data collected in the field needs to be organised so it makes sense. This means putting it into tables, graphs, maps and diagrams. Choosing the right type of presentation matters:
- 📊 Bar charts good for comparing categories (e.g. species count at different sites)
- 📈 Line graphs good for showing change over distance or time (e.g. pH along a river)
- 🌎 Annotated maps great for showing where things were found in the field
- 📷 Photographs with labels useful qualitative evidence
- ■ Scatter graphs used to show relationships between two variables
⑦ Step 7 Analyse and Interpret Results
Now you look at your data and ask: what does this actually mean? Look for patterns, trends and anomalies (results that don't fit the pattern). Use geographical and scientific knowledge to explain what you find.
- Trend: A general direction in the data (e.g. pH decreases downstream)
- Pattern: A repeating relationship in the data
- Anomaly: A result that doesn't fit always try to explain why it occurred
⑧ Step 8 Draw Conclusions
A conclusion links your results back to your original hypothesis. Was your prediction correct? Partly correct? Wrong? Either way, that's fine science isn't about being right, it's about finding out the truth. Always use data to support your conclusion.
💡 Example Conclusion
"The results support the hypothesis. pH decreased from 7.4 at Site 1 to 6.1 at Site 5, suggesting increasing acidity downstream. This is likely caused by agricultural runoff from the fields between Sites 3 and 4, where a sharp drop in pH was recorded."
⑨ Step 9 Evaluate the Investigation
The final step is being honest about the strengths and weaknesses of your investigation. This is called an evaluation. Examiners love this it shows you understand the limits of your own work.
✅ What Makes a Strong Investigation?
- Large sample size (more data = more reliable)
- Repeat measurements taken at each site
- Equipment calibrated correctly
- Random sampling used to avoid bias
- Results consistent with other studies
❌ Common Weaknesses
- Too few sample sites or quadrats
- Only one measurement taken (no repeats)
- Human error in reading equipment
- Weather conditions changing during data collection
- Biased sampling (e.g. only sampling easy-to-reach spots)
🌿 Variables in Environmental Fieldwork
Understanding variables is essential for a fair investigation. There are three types you need to know:
- 🔴 Independent Variable: The thing you deliberately change or choose (e.g. the location/site along the river)
- 🟢 Dependent Variable: The thing you measure it depends on the independent variable (e.g. the pH reading at each site)
- 🔵 Control Variables: Everything else you keep the same to make it a fair test (e.g. using the same pH meter at every site, measuring at the same time of day)
🌎 Case Study: Microclimate Investigation Urban vs Rural
A group of students compared the microclimate of a city centre with a nearby rural area (the urban heat island effect). Their hypothesis was: "The city centre will be warmer and have lower wind speeds than the rural area due to heat absorption by buildings and reduced vegetation." They measured temperature, wind speed, humidity and cloud cover at 10 sites in each location at the same time of day. Results showed the city was on average 2.3°C warmer, supporting the urban heat island theory. They identified a weakness: measurements were taken on a single day, so seasonal variation wasn't accounted for.
📋 Sampling Methods in Fieldwork
You can't measure everything everywhere so you take samples. The way you choose your samples affects how reliable your results are.
🎲 Random Sampling
Sample locations are chosen using random numbers. This avoids bias and gives every location an equal chance of being selected. Best used in large, uniform areas like grassland.
📈 Systematic Sampling
Samples are taken at regular intervals for example, every 10 metres along a transect. Good for showing gradual change across an area, like vegetation change from a path into woodland.
🌍 Stratified Sampling
The area is divided into groups (strata) and samples are taken from each group in proportion to its size. Useful when the environment has distinct zones, like different soil types.
📚 Exam Tip Writing About the Scientific Method
In your iGCSE exam, you may be asked to plan an investigation, suggest improvements, or evaluate a method. Always use the correct vocabulary: hypothesis, variable, sample, reliable, valid, anomaly, conclusion. Examiners award marks for using these terms correctly in context. Remember: a good evaluation doesn't just say "we could improve by taking more samples" it explains why more samples would improve reliability.