Introduction to The Bradshaw Model
The Bradshaw Model (sometimes called the River Channel Velocity-Shape Model) shows how a river's characteristics change as it flows from its source in the mountains to its mouth at the sea. It's one of the most useful models in physical geography for understanding how rivers work and why they look different along their course.
Key Definitions:
- Bradshaw Model: A geographical model that describes how river characteristics change from source to mouth.
- Long profile: The gradient of a river from its source to its mouth.
- Cross profile: The shape of the river channel when viewed from directly in front.
- Discharge: The volume of water flowing through a river channel at a given point (measured in cumecs - cubic metres per second).
- Load: The material carried by a river (bedload, suspended load, dissolved load).
📖 Origins of the Bradshaw Model
The model was developed by British geographer John Bradshaw in 1975. He wanted to create a simple way to show how river characteristics change predictably along the course of a river. The model helps us understand why rivers look and behave differently in their upper, middle and lower courses.
💡 Why Study River Changes?
Understanding how rivers change helps us predict flooding, manage river environments, plan settlements and understand erosion and deposition patterns. The Bradshaw Model gives us a framework to understand these changes in a systematic way.
The Changing River Profile
As rivers flow from their source to mouth, they undergo predictable changes in their characteristics. The Bradshaw Model identifies several key variables that change along a river's course:
💧 Upper Course
Channel width: Narrow
Channel depth: Shallow
Velocity: Slow
Discharge: Low
Load size: Large, angular
Gradient: Steep
Features: V-shaped valleys, waterfalls, rapids
💧 Middle Course
Channel width: Wider
Channel depth: Deeper
Velocity: Faster
Discharge: Medium
Load size: Medium, more rounded
Gradient: Gentler
Features: Meanders, wider floodplains
💧 Lower Course
Channel width: Very wide
Channel depth: Very deep
Velocity: Variable but generally fast
Discharge: High
Load size: Small, rounded
Gradient: Very gentle
Features: Floodplains, levees, deltas
Key Variables in the Bradshaw Model
The Bradshaw Model tracks several variables that change systematically as you move downstream. Let's look at each in more detail:
Channel Width and Depth
As you move downstream, both the width and depth of a river channel increase. This happens because:
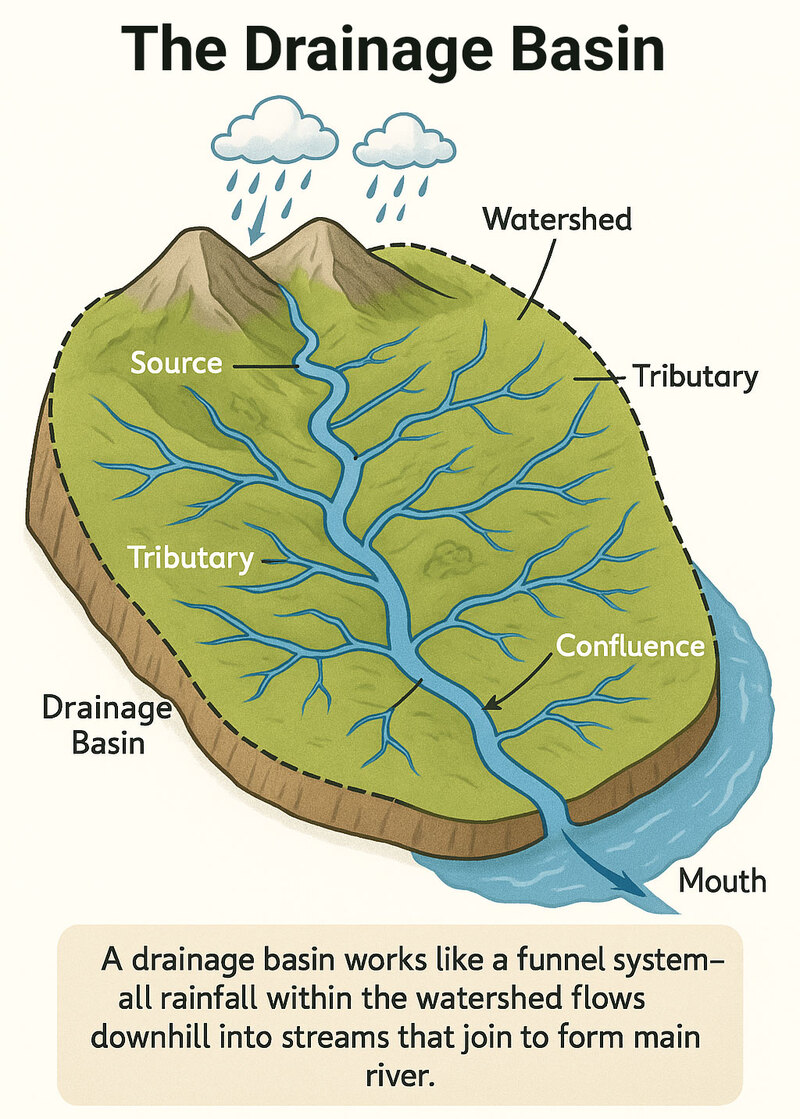
- More tributaries join the main river, adding water
- Erosion widens and deepens the channel over time
- The river has more energy to erode its banks in the middle and lower courses
The width-depth ratio also changes. In the upper course, the channel might be 2m wide and 0.5m deep (ratio 4:1). By the lower course, it could be 50m wide and 5m deep (ratio 10:1).
Velocity and Discharge
Both velocity (speed of flow) and discharge (volume of water) increase downstream. This might seem strange since the gradient decreases, but it happens because:
- The channel becomes more efficient (smoother) with less friction
- More tributaries join, adding water volume
- The hydraulic radius increases (the ratio of cross-sectional area to wetted perimeter)
Discharge can increase dramatically - from less than 1 cumec near the source to hundreds or even thousands of cumecs at the mouth.
Load Characteristics
The river's load (material it carries) changes significantly:
- Size: Decreases downstream due to attrition (particles knocking together) and abrasion
- Shape: Becomes more rounded downstream
- Sorting: Becomes better sorted (more uniform in size) downstream
- Type: More suspended and dissolved load relative to bedload downstream
In the upper course, you might find large boulders, while in the lower course, you'll mainly see sand and silt.
Case Study Focus: River Severn
The River Severn in the UK provides an excellent example of the Bradshaw Model in action. At its source in the Welsh mountains, the Severn is just a small stream about 1m wide and 30cm deep, with a discharge of less than 0.5 cumecs. The channel contains large, angular rocks and flows rapidly down steep slopes.
By the middle course near Shrewsbury, the river is about 30m wide and 2m deep, with a discharge of around 25 cumecs. The load consists mainly of pebbles and gravel and meanders begin to form.
At Gloucester in the lower course, the Severn is approximately 100m wide and 8m deep, with a discharge of over 100 cumecs. The load is mainly fine sand and silt and the river flows across a wide floodplain before entering the Bristol Channel.
Graphical Representation of the Bradshaw Model
The Bradshaw Model is often represented as a series of graphs showing how different variables change from source to mouth. These graphs typically show:
📈 Variables that Increase Downstream
- Channel width
- Channel depth
- Velocity
- Discharge
- Efficiency
- Suspended load
- Dissolved load
📉 Variables that Decrease Downstream
- Gradient
- Bed load size
- Bed load angularity
- Channel roughness
- Friction
Applying the Bradshaw Model
The Bradshaw Model is a useful tool for geographers because it helps us:
- Predict how rivers will behave at different points along their course
- Understand why certain landforms develop in specific locations
- Assess flood risk in different parts of a river basin
- Plan river management strategies appropriate to each section of a river
Fieldwork Applications
When conducting river fieldwork, you can test the Bradshaw Model by measuring:
- Channel width and depth using measuring tapes or meter sticks
- Velocity using a flow meter or float-and-timer method
- Discharge by calculating width × depth × velocity
- Bed load size and shape using callipers and Powers Scale of Roundness
- Gradient using clinometers or topographic maps
Taking these measurements at several sites from source to mouth allows you to create your own Bradshaw Model graphs for a specific river.
Case Study Focus: River Tees
The River Tees in northern England shows clear Bradshaw Model characteristics. Near its source at Cross Fell in the Pennines, the river flows through steep V-shaped valleys with waterfalls like High Force (21m drop). The channel is narrow (2-3m) with large boulders.
In the middle course near Barnard Castle, the valley widens, meanders develop and the river is around 15m wide with a mix of pebbles and gravel on the bed.
By the time it reaches Middlesbrough in its lower course, the Tees is over 250m wide, flows across a broad floodplain and carries mainly fine sediment. The river mouth features extensive mudflats and estuarine environments.
Limitations of the Bradshaw Model
While the Bradshaw Model is useful, it has several limitations you should be aware of:
⚠️ Simplification
The model simplifies complex river systems. Real rivers don't always follow the ideal pattern due to local factors like geology, climate and human interference.
⚠️ Assumes Natural State
The model assumes rivers are in their natural state, but many rivers are heavily modified by dams, channelization and other human interventions that disrupt natural patterns.
⚠️ Ignores Local Factors
Local geology, tributaries and land use can cause significant deviations from the model's predictions. For example, a resistant rock band can create rapids in the lower course.
Exam Tips for the Bradshaw Model
In your Cambridge iGCSE Geography exam, you might be asked to:
- Explain how and why specific river characteristics change from source to mouth
- Interpret graphs showing changes in river variables
- Apply the model to explain the formation of specific landforms
- Evaluate the usefulness and limitations of the model
- Describe how human activities might disrupt the natural patterns described by the model
Remember to use specific examples and case studies to support your answers and always consider both the strengths and limitations of the model.
Key Takeaways
The Bradshaw Model shows us that rivers change in predictable ways as they flow from source to mouth:
- They get wider, deeper and carry more water
- Their load becomes smaller, more rounded and better sorted
- Their gradient decreases but velocity generally increases
- Different erosional and depositional landforms develop in different sections
Understanding these changes helps us better manage rivers, predict flooding and explain the diverse landscapes rivers create.