🌧 Peak rainfall
The time when the most rain falls. It is the tallest bar on the graph.
Sign up to access the complete lesson and track your progress!
Unlock This Course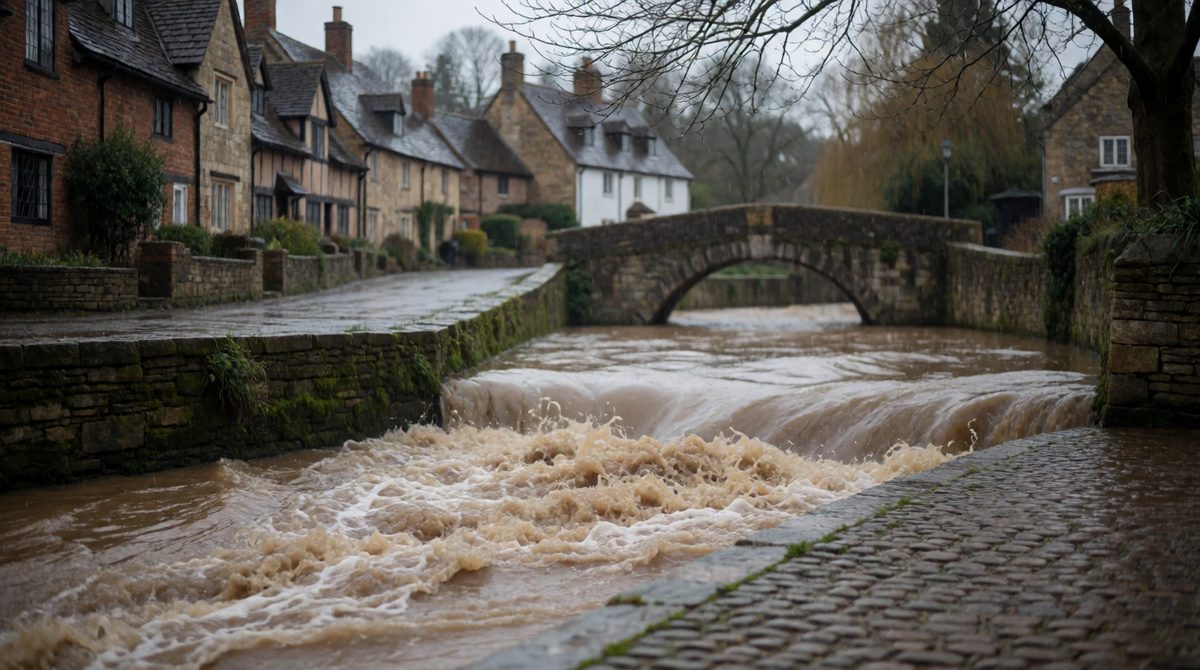
After heavy rain the river rises to a peak, which a hydrograph shows
When it rains, a river does not rise at once. The water has to run off the land and flow into the channel first. A hydrograph is a graph that shows exactly how a river reacts to a rainstorm.
It shows two things on the same graph:
The bottom axis shows time, for example in hours or days. The left axis shows discharge. Discharge is measured in cumecs, which means cubic metres per second (m3/s). One cumec is one cubic metre of water passing a point every second.
Key terms:
A flood hydrograph has a clear pattern. Learn each part and what it means.
The time when the most rain falls. It is the tallest bar on the graph.
The highest point on the discharge line. This is when the river is at its fullest and flooding is most likely.
The time between peak rainfall and peak discharge. It is the delay while rain travels to the river.
The part of the discharge line that goes up. The river is filling as water reaches the channel.
The part of the discharge line that goes down. The river is draining back to normal as the storm water passes.
The normal level of the river fed by groundwater, before and after the storm. It is the line the discharge starts and ends on.
Key terms:
Rain that lands far from the river takes time to get there. Some falls on leaves and is held for a while. Some soaks into the soil and moves slowly underground. Water that runs over the surface arrives first. Water that moves through the soil arrives later. This is why the peak of the river comes after the peak of the rain.
The rising limb is steep when lots of water arrives quickly. The falling limb is usually gentler, because water keeps draining in from the soil and the slopes for some time after the rain stops.
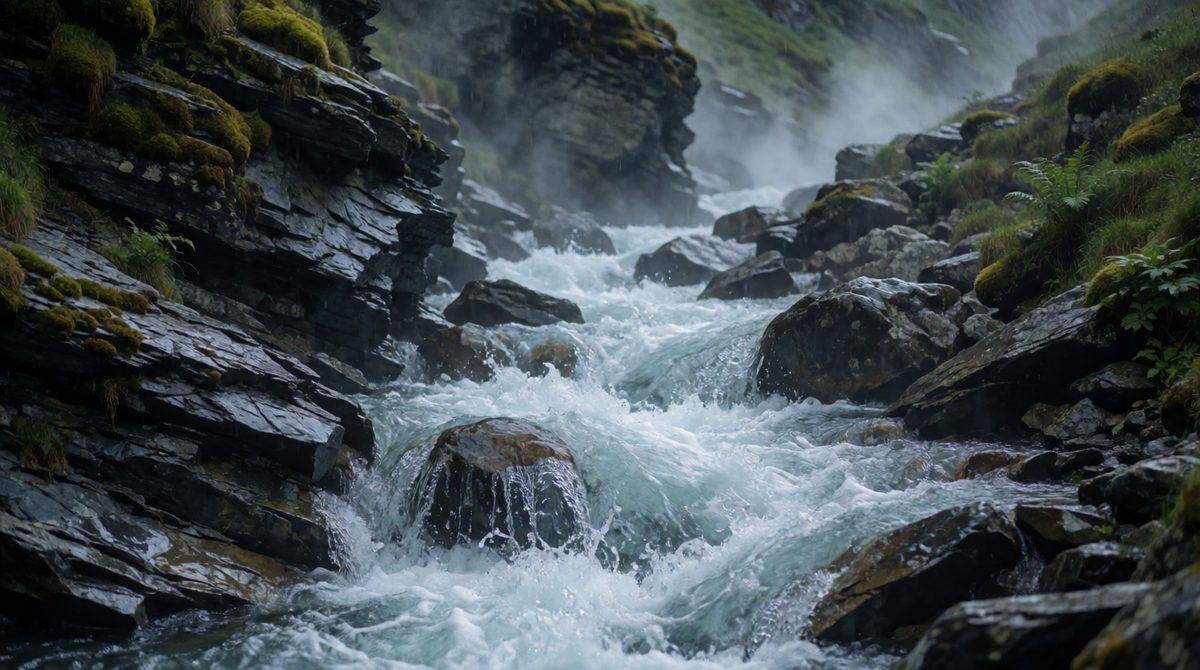
Steep, rocky land makes a flashy hydrograph with a quick peak
Hydrographs for different rivers, or for the same river in different conditions, can look very different. Geographers describe two main shapes.
A short lag time, a steep rising limb and a high peak discharge. Water reaches the river quickly and in large amounts. The risk of flooding is high.
A long lag time, a gentle rising limb and a low peak discharge. Water reaches the river slowly and in smaller amounts. The risk of flooding is lower.
Key terms:
Remember, the flood risk factors from the last lesson decide which shape a river has. A hydrograph is only flashy or gentle when you compare it with another one.
Follow these steps in the exam.
A storm gives peak rainfall at 06:00. The river reaches its peak discharge of 80 cumecs at 09:00. Before the storm, the base flow was 10 cumecs.
Lag time = 09:00 - 06:00 = 3 hours.
The discharge rose by 80 - 10 = 70 cumecs above base flow.
Another river has a lag time of 10 hours and a peak of 20 cumecs. The river with the 3 hour lag and the 80 cumec peak is the flashier one.
You may be asked to describe the relationship shown. Use the key terms and use numbers from the graph. For example: "Discharge rises sharply after the heaviest rainfall. The peak discharge is 80 cumecs, three hours after the peak rainfall. It then falls slowly back to the base flow."
Always give the idea (what happens) and the evidence (a figure from the graph).
Students often say the lag time is the time between the start of the rain and the start of the rise. It is the time between peak rainfall and peak discharge. Another mistake is to mix up the limbs: the rising limb goes up, the falling limb goes down. Finally, do not forget the units. Discharge is in cumecs, not millimetres.
The hydrograph shows a storm on a river. Peak rainfall was at 12:00. Peak discharge of 45 cumecs was at 14:00. Base flow was 5 cumecs.
(a) State the lag time. [1 mark]
(b) Explain why there is a lag time between peak rainfall and peak discharge. [2 marks]
(c) Describe the shape of a flashy hydrograph. [3 marks]
(a) 2 hours (1).
(b) The rain takes time to reach the river (1). It has to flow over the land, drip off plants or move through the soil before it enters the channel (1).
(c) It has a short lag time (1), a steep rising limb (1) and a high peak discharge (1).
For (a), subtract the two times and write the unit (hours). A number with no unit can lose the mark.