🏖 Physical data
Beach pebble size, beach gradient, wave height, soil depth, or the plants growing at different points on a sand dune. Secondary physical data could be tide tables or rainfall records.
Sign up to access the complete lesson and track your progress!
Unlock This Course
Measuring and recording data carefully is key to good fieldwork
Once you have a question or hypothesis, you need data to answer it. AQA calls this strand 2: selecting, measuring and recording data appropriate to your enquiry. You must pick data that really tests your question, collect it in a sensible way and write it down accurately.
Remember, primary data is collected first-hand by you in the field. Secondary data was collected by someone else, such as a census, a weather report or an old map. Every enquiry must include primary data. Secondary data is useful for extra background and for comparing with your own results.
Your choice of data depends on the question. Physical enquiries need data about the natural environment. Human enquiries need data about people and the places they build. Some enquiries need both.
Beach pebble size, beach gradient, wave height, soil depth, or the plants growing at different points on a sand dune. Secondary physical data could be tide tables or rainfall records.
Traffic counts, answers to a questionnaire, shop types on a high street, or an environmental quality score. Secondary human data could be census figures or house price records.
Choose data that is appropriate. If your question is about how pebbles change along a beach, then measuring pebble size is appropriate. Counting the visitors would not help at all.
You cannot measure every pebble on a beach or ask every person in a town. So you collect a sample: a smaller set of measurements chosen to represent the whole area or population. Sampling is the way you choose which measurements to take. A bigger sample is more likely to give a fair picture, but it takes more time. A good sample is large enough to be useful and small enough to collect in the time you have.
Every item has an equal chance of being chosen. You might use random numbers from a calculator to pick the spots, so you cannot choose your favourites. This avoids bias, which is when the results lean towards one result because of how the sample was picked. It can miss parts of the area by chance.
You sample at regular intervals, for example every 10 metres along a line. It is quick, easy and covers the whole area evenly. It could miss a pattern that repeats at the same spacing.
You split the population into groups, then sample each group in proportion to its size. It makes sure every group is fairly represented. It needs more planning and you must know the size of each group first.
Key terms:
You want to ask 40 people about a seaside town. Of the people you can meet, 60% are residents, 30% are day visitors and 10% are staying visitors. A stratified sample would ask 24 residents (60% of 40), 12 day visitors (30% of 40) and 4 staying visitors (10% of 40). The 40 answers now match the mix of people in the town.
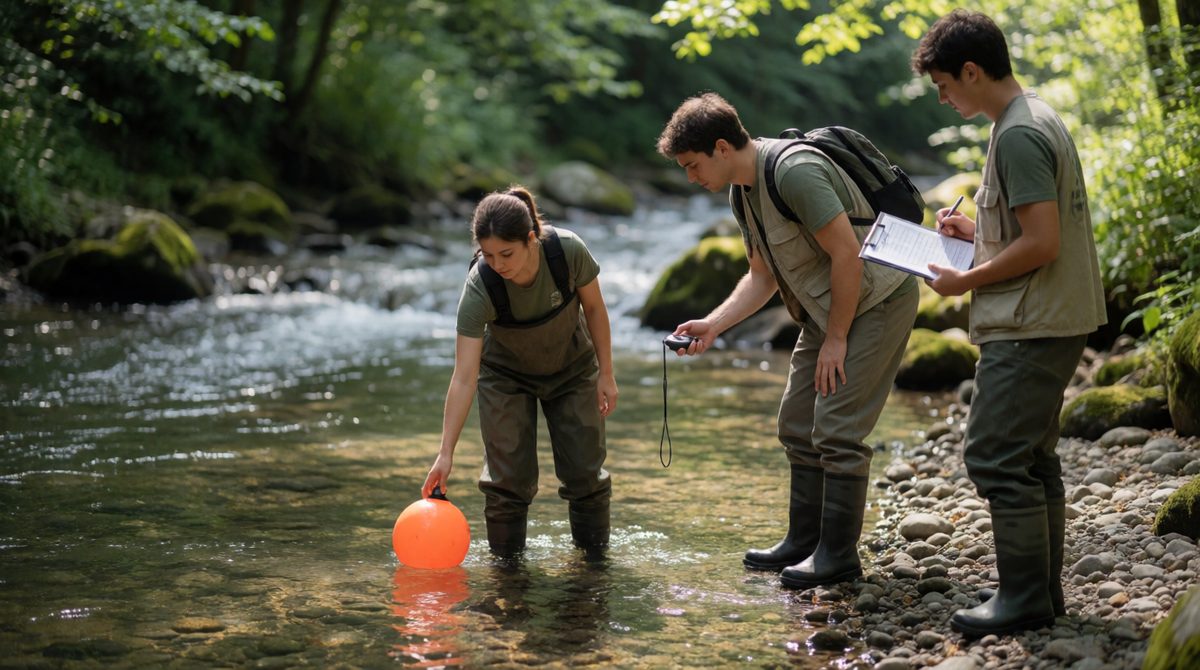
Physical data like river speed is measured with simple equipment
Different data needs different equipment. Always use the same method at every site so that results can be compared.
Write down every result clearly, with the site, the time, the date and the units. Write neatly and double-check each number before you move on. Taking a photo or a field sketch can also help you remember the site later.
In the exam you must be able to describe a method (say exactly what you did, step by step) and justify it (say why it was the best choice). A good justification links the method to the question, the type of data and the sampling choice.
"We placed a 1 m quadrat every 10 metres along a transect from the beach to the back of the dune. We estimated the percentage plant cover and recorded it."
"Regular intervals covered the whole dune evenly, so we could see how plant cover changed with distance from the sea. A quadrat gave the same sized area each time, so the results could be compared fairly."
Students say "we took a random sample" when they actually chose spots by eye. Others only describe what they did and forget to say why. Another mistake is to use different methods or different times at each site, which makes the results unfair to compare.
A group of students investigated how the size of pebbles changes along a beach. They collected primary data at five sites.
(a) Name one piece of equipment they could use to measure pebble size. [1 mark]
(b) The students used systematic sampling to choose their sites. Describe how they could do this. [2 marks]
(c) Justify the use of systematic sampling in this enquiry. [2 marks]
(a) A ruler or callipers (1).
(b) They would choose sites at regular intervals along the beach, such as every 20 metres (1). They would start at one end and measure at each interval until the other end (1).
(c) Sites at regular intervals cover the whole beach evenly (1), so the students could see how pebble size changes along the beach and compare the sites fairly (1).
In a "justify" question, always give a reason that links back to the enquiry question, such as "so they could see how size changed along the beach".