▲ Lines close together
The land rises or falls quickly. The slope is steep. A cliff can look like lines almost touching.
Sign up to access the complete lesson and track your progress!
Unlock This Course
Contour lines on a map show the height and shape of the land
An OS map is flat, but the land is not. Mapmakers show height in two main ways. Remember, relief means the height and shape of the land. This lesson shows you how to read it.
Key terms:
Contour lines are drawn at regular height steps. This step is called the contour interval. On a 1:50 000 map it is normally 10 metres. On a 1:25 000 map it is normally 5 metres. Every fifth line is thicker and has its height written on it.
The land rises or falls quickly. The slope is steep. A cliff can look like lines almost touching.
The land rises or falls slowly. The slope is gentle. Very few lines means flat land.
To tell which way a slope goes, look at the numbers on the lines. The numbers get bigger as you go uphill. Spot heights help here. A spot height of 214 beside a ring of contours tells you that the middle is the top of a hill.
Gradient compares how far you go up with how far you go along. Use this method:
A path climbs from 100 m to 150 m. The distance along the map is 1 km (1,000 m).
Height difference = 150 - 100 = 50 m.
Gradient = 50 / 1,000. Simplify the fraction to 1/20, which is written 1 in 20 (or 1:20).
A gradient of 1 in 20 is a gentle climb. A gradient of 1 in 5 is steep.
Different patterns of contour lines make different shapes. Learn these five.
Rings of contours, one inside the other. The numbers rise towards the centre. Often a spot height at the top.
Contours form V shapes or U shapes. The points of the V point uphill, towards higher ground. A river usually runs along the bottom.
A long, narrow line of high ground. The contours run as long, thin shapes with steep sides.
High land that is flat on top. There are few contours across the top, with closely packed lines at its edges.
A piece of high land that sticks out from a hill, with contours pointing downhill, like the tip of a finger.
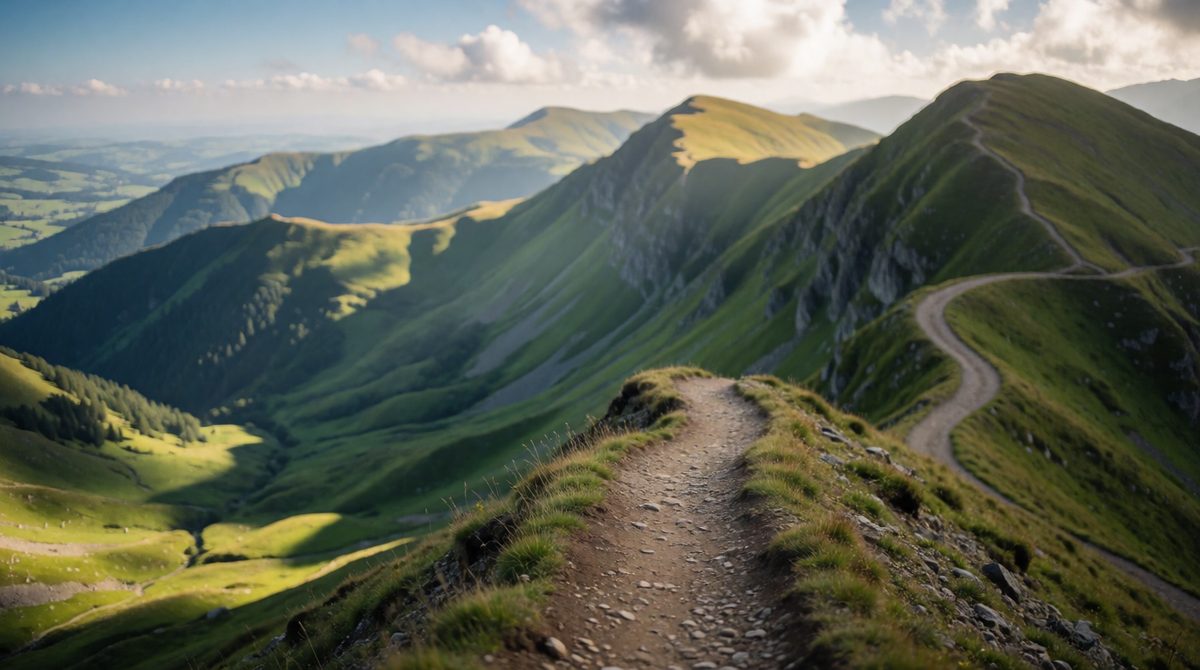
A cross section shows the shape of the land between two points
A cross section turns contour lines into a side view. To draw one:
The steep parts of the cross section match places where contours are close together. A flat section matches widely spaced lines. Use this to name a feature. A drawing with a bowl shape and steep sides is a valley. A drawing with a flat top is a plateau.
A transect on a map is a line across the map along which you record what you find, such as land use or relief. A transect of a physical and human landscape might show a river, then fields, then houses, then a road.
You can use an OS map as evidence to make inferences. An inference is a conclusion drawn from clues. Always give the clue and then what it suggests.
On large scale maps you may be asked to describe the physical features of two landscapes. Here are the map clues for three.
Cliffs shown with black lines and ticks. Yellow beaches. Headlands that stick out and bays that curve inwards. Spits and sand dunes by the shore.
A blue line. V-shaped valleys with close contours near the source. Wide, flat land and loops (meanders) lower down. Contours V point upstream.
Wide, flat-bottomed U-shaped valleys. Armchair shaped hollows with close contours, often with a small lake. Long thin lakes on the valley floor.
When you describe them, use the names you know from the physical landscapes lessons. Give the map evidence too, for example the contour pattern or a grid reference.
Symbols show what people do. A map key lists them. Clues for tourism include:
Other human activity can also be inferred. Quarries show that stone, sand or gravel is being dug out. Farms show farming. A railway station and many roads suggest a town that people travel to. The more tourist symbols in one area, the more likely it is to be popular with visitors.
1. Reading contour numbers the wrong way, so a hill looks like a valley. Check which way the numbers rise.
2. Saying 'steep' when the lines are far apart. Close lines mean steep.
3. Mixing units in gradient. Change kilometres to metres first.
4. Describing a feature without giving map evidence.
The map shows a hillside. A path climbs from a spot height of 120 m to the top of a hill at 220 m. The path is 2 km long on the map.
(a) Calculate the gradient of the path. Show your working. [2 marks]
(b) The contour lines close to the viewpoint are very close together. What does this tell you about the slope? [1 mark]
(c) Give two pieces of map evidence that the area is used for tourism. [2 marks]
(a) Height difference = 220 - 120 = 100 m (1). Gradient = 100 / 2,000 = 1 in 20 (1).
(b) The slope is steep (1).
(c) Any two from: a viewpoint symbol (1), a car park (1), a picnic site (1), a camp site (1), a long distance footpath (1).
Change 2 km into 2,000 m before you divide. Marks are often lost because the two distances use different units.