✅ On the curve
Resources are fully employed. The economy is at its maximum productive potential. Points A to F are all on the curve.
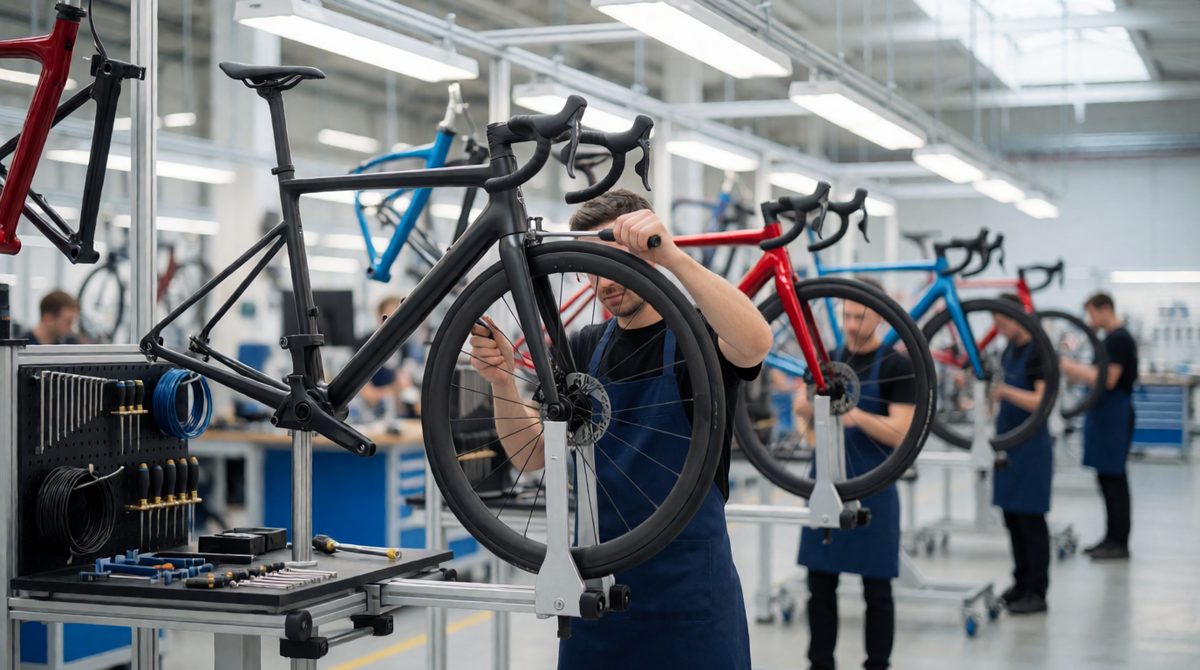
A factory that makes more of one product must make less of another: that trade-off is what a PPC shows
You already know that resources are scarce, so an economy cannot make everything it wants. You also know that every choice has an opportunity cost. A production possibility curve puts both ideas into one simple diagram. This topic is part of Paper 1 (Microeconomics and Business Economics).
Key terms:
Imagine the country of Brindle. It uses all its workers, land and machines to make just two things: laptops and bicycles. Here is the most it can make in a year, using everything it has.
| Point | Laptops (thousands) | Bicycles (thousands) |
|---|---|---|
| A | 0 | 60 |
| B | 10 | 55 |
| C | 20 | 45 |
| D | 30 | 30 |
| E | 40 | 10 |
| F | 45 | 0 |
To draw the diagram in the exam, follow these steps:
The curve slopes downwards because resources are scarce. To make more laptops, Brindle must move workers and machines away from bicycles.
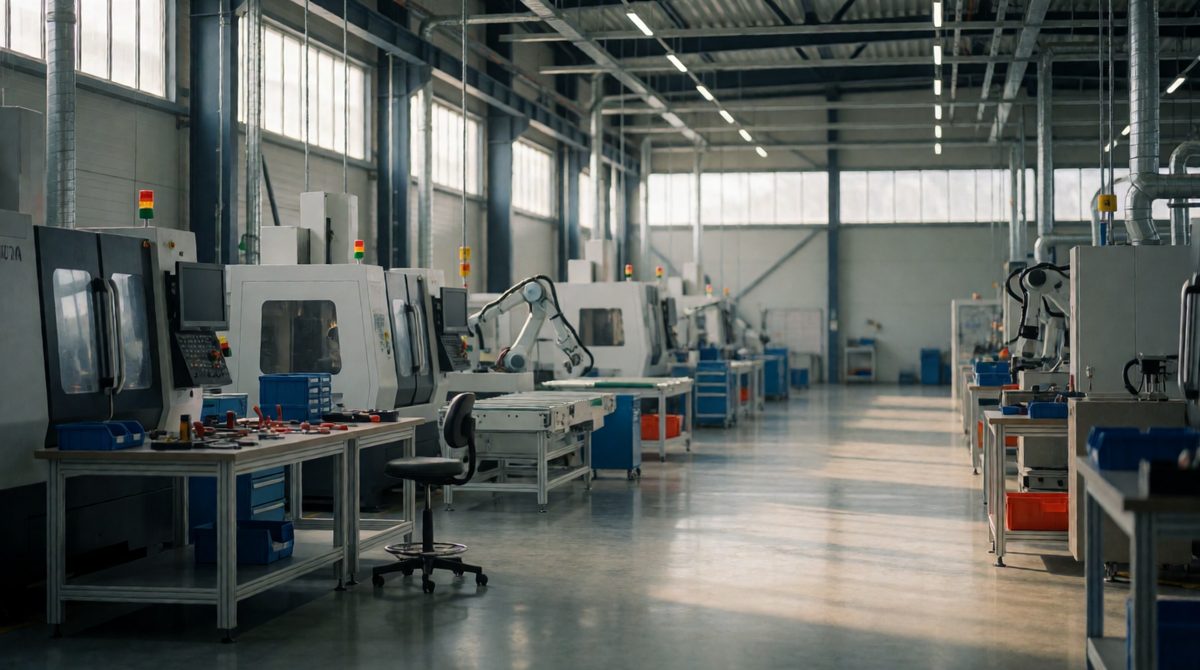
Idle machines mean unemployed resources, so the economy is producing inside its PPC
Resources are fully employed. The economy is at its maximum productive potential. Points A to F are all on the curve.
Some resources are unemployed or wasted. Brindle could make more of both goods. Point G (20 laptops, 30 bicycles) is inside the curve.
Unobtainable. The economy does not have enough resources. Point H (40 laptops, 40 bicycles) is outside the curve.
Points on the curve and inside it are possible production. Points outside it are unobtainable production, at least with the resources the country has today.
Look at point G. At G, Brindle makes 20 laptops and 30 bicycles. It could move up to C and make 20 laptops and 45 bicycles. That is 15 thousand extra bicycles and no fewer laptops. Using idle resources gives more output at no cost to the other good.
When the economy is already on the curve, it cannot make more of one good without making less of the other. The opportunity cost of moving along the PPC is the amount of the other good given up.
Brindle moves from point C (20 laptops, 45 bicycles) to point D (30 laptops, 30 bicycles).
Laptops rise by 30 - 20 = 10 thousand.
Bicycles fall by 45 - 30 = 15 thousand.
So the opportunity cost of 10 thousand more laptops is 15 thousand bicycles.
For one extra laptop, the opportunity cost is 15 ÷ 10 = 1.5 bicycles.
Now move from D to E (40 laptops, 10 bicycles). Laptops rise by 10 thousand. Bicycles fall by 30 - 10 = 20 thousand. The opportunity cost of those 10 thousand laptops is 20 thousand bicycles, which is 2 bicycles per laptop.
Notice that the cost went up from 1.5 bicycles per laptop to 2. Along this PPC, each extra laptop costs more bicycles. That is why the curve gets steeper.
Find out which good is on which axis before you read any numbers. Mixing them up is an easy way to lose marks.
Write answers with units, such as 15 thousand bicycles. Say what was given up, not just a number.
Saying a point inside the curve is "impossible". It is possible, but it wastes resources. Only points outside the curve are unobtainable. Another slip is saying there is an opportunity cost when moving from inside the curve up to the curve. Unemployed resources are being put to use, so nothing has to be given up. Finally, give the cost in the other good: the opportunity cost of laptops is measured in bicycles, not laptops.
The country of Tarn makes buses and solar panels. The table shows the most it can make using all its resources.
| Point | Buses (hundreds) | Solar panels (thousands) |
|---|---|---|
| P | 0 | 40 |
| Q | 10 | 36 |
| R | 20 | 28 |
| S | 30 | 16 |
| T | 40 | 0 |
Tarn is currently producing 20 hundred buses and 16 thousand solar panels. This is called point U.
(a) Identify what point U shows about Tarn's resources. [1 mark]
(b) Calculate the opportunity cost, in solar panels, of increasing bus production from 10 hundred (point Q) to 20 hundred (point R). [2 marks]
(c) Explain why 30 hundred buses and 30 thousand solar panels is unobtainable for Tarn. [2 marks]
(d) Explain why moving from U to R would have no opportunity cost. [2 marks]
(a) Some resources are unemployed (not fully used), because U is inside the curve. (1)
(b) Solar panels fall from 36 to 28 thousand (1), so the opportunity cost is 8 thousand solar panels (1).
(c) At 30 hundred buses, the most Tarn can make is 16 thousand solar panels (1), so 30 thousand is outside the curve and needs more resources than Tarn has (1).
(d) At U, some resources are unused (1), so Tarn can make 12 thousand more solar panels while still making 20 hundred buses, without taking resources away from anything else (1).
In part (b), subtract the two solar panel figures and give the answer in the unit on the axis, "thousand solar panels", not just "8".
Access the full course and all the resources like custom timetables and progress tracking.
Join Today