🌾 More or better resources
New land is farmed, new factories are built, or a larger workforce joins the economy. Better quality resources, such as more fertile soil, also push the frontier out.
Sign up to access the complete lesson and track your progress!
Unlock This CourseIn the last lesson the production possibility curve stayed still. Now we let it move. An economy's resources do not stay the same for ever, so its maximum productive potential changes too. This topic is part of Paper 1 (Microeconomics and Business Economics).
Key terms:
Imagine the country of Veda, which makes only food and clothes. Here is its maximum output in a year, before and after it gains more resources.
| PPF | Maximum food (if no clothes are made) | Maximum clothes (if no food is grown) |
|---|---|---|
| PPF1 (before) | 80 thousand tonnes | 50 thousand items |
| PPF2 (after) | 100 thousand tonnes | 65 thousand items |
To show this in the exam, follow these steps:
Both ends of the curve have moved out, so the whole frontier has shifted. The economy can now make more food, more clothes, or more of both. Some points that were unobtainable on PPF1, those between the two curves, can now be reached. This is positive economic growth. Growth also widens the choices on offer: Veda could now have more food without giving up any clothes. Remember that the economy only gets the benefit if it actually uses its new resources. If it stays inside the new curve, some are unemployed.
Now imagine Veda loses some of its resources. The same steps apply, but PPF2 is drawn closer to the origin than PPF1, with arrows pointing inwards. The maximum productive potential has fallen. Combinations that were on the old curve, such as the old maximum of 80 thousand tonnes of food, are now unobtainable. This is negative economic growth.
Do not mix this up with a move from the curve to a point inside it. That shows resources becoming unemployed, so the frontier has not moved at all. A shift of the curve means the economy's productive potential has really changed.
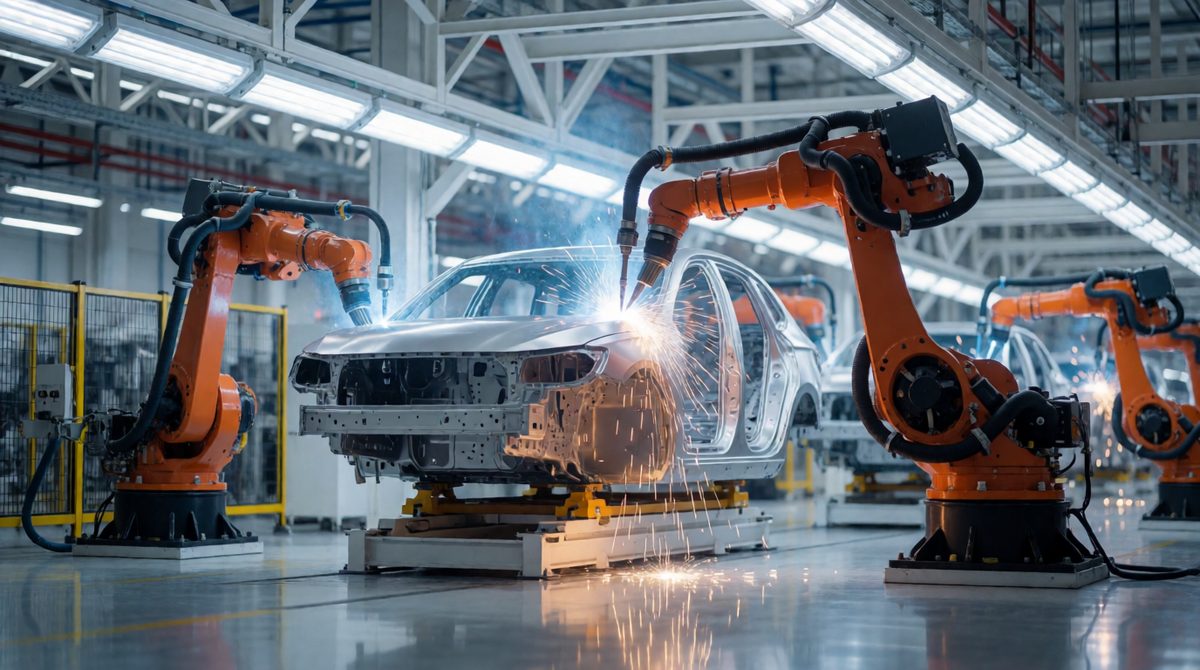
New technology lets the same workers make more, pushing the PPF outwards: positive economic growth
New land is farmed, new factories are built, or a larger workforce joins the economy. Better quality resources, such as more fertile soil, also push the frontier out.
Better machines and computers let the same resources make more output. A farm that buys a modern harvester can produce more food with the same workers.
Schools and training give workers more skills. A more skilled workforce can make more goods and services, so the frontier shifts outwards.
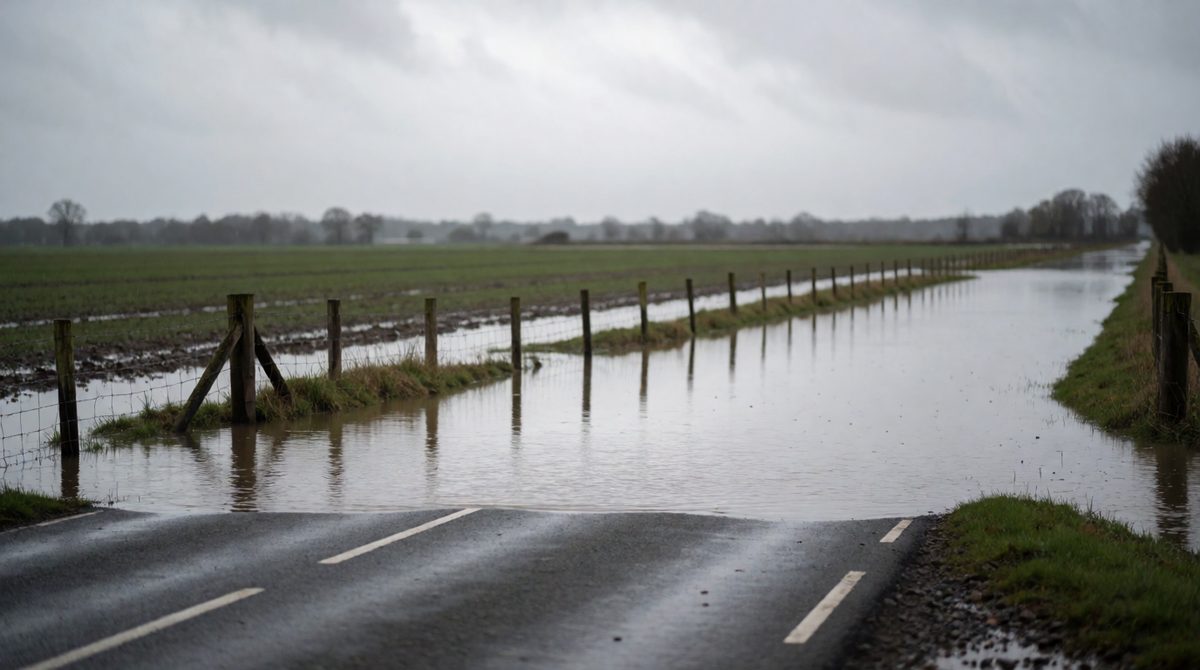
Floods destroy farmland, roads and buildings, so the economy can produce less and the PPF shifts inwards
Floods, earthquakes and hurricanes can destroy factories, farmland, roads and homes. The country has less capital to produce with.
War destroys buildings and equipment and kills or displaces workers, so the economy can produce less.
If a country depends on an oil field or a fishing area that is used up, it has fewer resources left to use.
When many working-age people leave the country, the workforce gets smaller. If skilled workers leave, the quality of labour falls too.
Veda's PPF1 allows a maximum of 80 thousand tonnes of food if no clothes are made. After a big investment in new machinery, the maximum is 100 thousand tonnes of food. By how much has the frontier shifted at the food axis, and what does this show? The maximum has risen by 100 - 80 = 20 thousand tonnes. This shows positive economic growth, because the PPF has shifted outwards.
Students often draw the second curve crossing the first one, or forget to label the curves PPF1 and PPF2 and to add arrows showing which way the frontier moved. Another slip is to say a point inside the curve is "negative growth". That is unemployed resources. Negative growth needs the whole frontier to move inwards.
The table shows the maximum output of the country of Korva in two years. Korva makes only wheat and cars.
| Year | Maximum wheat if no cars are made (thousand tonnes) | Maximum cars if no wheat is grown (thousands) |
|---|---|---|
| 2020 | 90 | 45 |
| 2025 | 70 | 30 |
(a) Identify what has happened to Korva's PPF between 2020 and 2025. [1 mark]
(b) State two possible causes of this change. [2 marks]
(c) Explain how a different change, such as new technology, would affect Korva's PPF. [3 marks]
(a) The PPF has shifted inwards (1).
(b) Any two from: a natural disaster, war, resources running out, emigration (1 + 1).
(c) New technology allows the same resources to produce more output (1). So the PPF would shift outwards (1), because the maximum amount of wheat and cars Korva can make would both rise, showing positive economic growth (1).
In part (c), name the direction of the shift (outwards) and use the words "positive economic growth". Compare the maximum figures in the table before you decide which way it moved.