💲 Demand for pounds
Foreign buyers need pounds to pay for UK exports of goods and services, to invest in the UK and to save in UK banks. More demand for UK exports means more demand for pounds.
This topic is examined on Paper 2: Macroeconomics and the Global Economy.
Sign up to access the complete lesson and track your progress!
Unlock This Course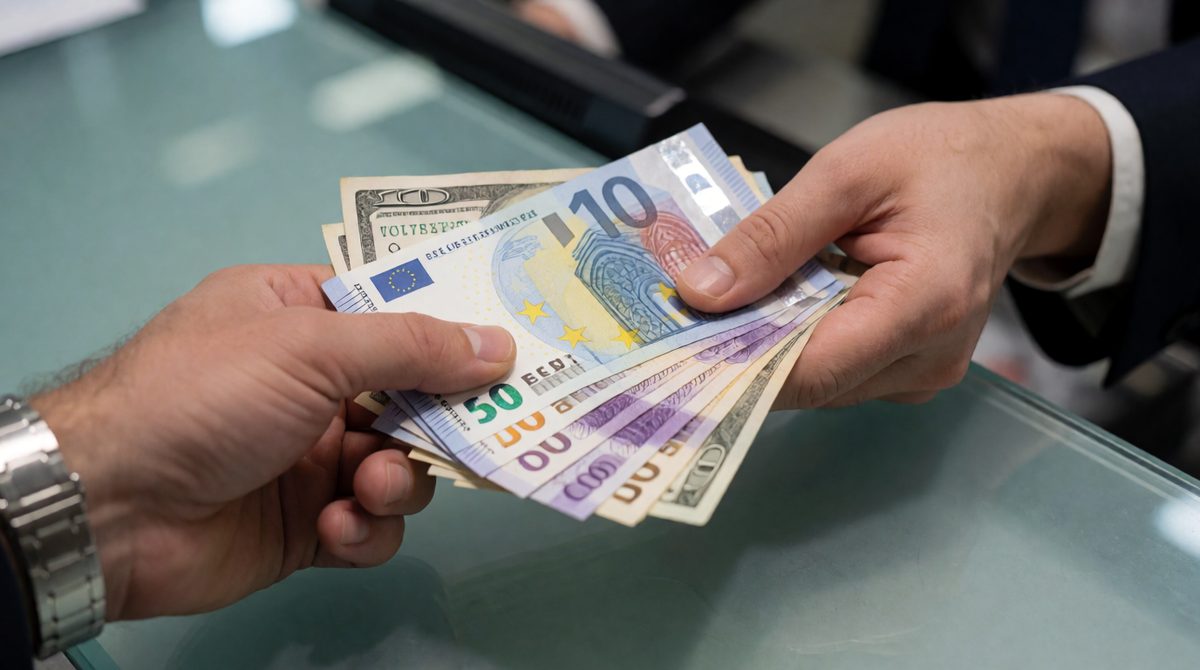
An exchange rate is the price of one currency in terms of another, as you see when you swap money for a trip
Countries use different money. A shop in the UK wants pounds. A shop in the USA wants dollars. To trade across borders, someone has to swap one currency for another, and the swap rate matters.
Key terms:
Suppose the exchange rate is £1 = $1.30. That means one pound buys 1.30 US dollars. Exchange rates change all the time, so this figure is only an example.
To convert, use the rate as a multiplier or divider.
The exchange rate is £1 = $1.30.
(a) A UK tourist swaps £200 into dollars: £200 × 1.30 = $260.
(b) A US trainer costs $91. What is the price in pounds? $91 ÷ 1.30 = £70.
Check (b): £70 × 1.30 = $91. Correct.
A second rate: £1 = €1.20. A UK firm buys €600 of goods. €600 ÷ 1.20 = £500.
A currency is bought and sold like any other product, so it has its own demand and supply. Think about the pound.
Foreign buyers need pounds to pay for UK exports of goods and services, to invest in the UK and to save in UK banks. More demand for UK exports means more demand for pounds.
UK buyers sell pounds to get foreign money to pay for imports. More UK imports means more pounds are supplied to the currency market.
The diagram assumes the exchange rate is set freely by the market. Look at this example schedule for the pound against the dollar.
| Exchange rate ($ per £1) | Demand for pounds (millions a day) | Supply of pounds (millions a day) |
|---|---|---|
| 1.10 | 140 | 60 |
| 1.20 | 120 | 80 |
| 1.30 | 100 | 100 |
| 1.40 | 80 | 110 |
| 1.50 | 60 | 120 |
At $1.30 demand equals supply. This is the equilibrium exchange rate. At $1.20 demand (120) is higher than supply (80), so there is a shortage of pounds and the rate is pushed up. At $1.50 supply (120) is higher than demand (60), so there is a surplus of pounds and the rate is pushed down.

Currency speculators buy and sell huge amounts of money, which can move exchange rates fast
When something changes the demand for or supply of a currency, a curve shifts and the equilibrium rate changes. Draw the new curve (D1 or S1), then mark the new rate P2 and quantity Q2.
| Factor | What happens | Shift on the pound diagram |
|---|---|---|
| Higher UK interest rates (compared with other countries) | Savers abroad move money into UK banks to earn more interest. They must buy pounds first. | D shifts right to D1. The rate rises. |
| Lower UK interest rates | Money leaves UK banks for countries with better returns. Pounds are sold. | D shifts left (and S shifts right). The rate falls. |
| Speculators expect the pound to rise | They buy pounds now to sell later at a profit. | D shifts right. The rate rises. |
| Speculators expect the pound to fall | They sell pounds now before the value drops. | S shifts right. The rate falls. |
| UK exports rise | Foreign buyers need more pounds to pay for them. | D shifts right. The rate rises. |
| UK imports rise | UK buyers sell more pounds to get foreign currency. | S shifts right. The rate falls. |
Speculation can be powerful. If many speculators expect a fall and all sell at once, their selling can cause the very fall they expected. What a rise or fall means for firms and for the current account is covered in the lesson Appreciation and Depreciation.
On the schedule above, foreign firms start buying many more UK goods. Demand for pounds rises by 30 million at every rate.
New demand: $1.30 gives 130, $1.40 gives 110, $1.50 gives 90. Supply at $1.40 is 110. The curves now cross at $1.40 (quantity 110 million). The exchange rate has risen from $1.30 to $1.40.
Country Zarmia uses the kell (K). The exchange rate is K1 = $0.50. Zarmia's central bank raises its interest rate from 3% to 6%. Other countries keep their interest rates the same. Zarmia also sells more cocoa to the USA.
(a) Define 'exchange rate'. [2 marks]
(b) A US visitor to Zarmia swaps $200 into kells. Calculate how many kells the visitor receives. [2 marks]
(c) Explain one reason why the higher interest rate may increase the demand for the kell. [3 marks]
(d) Explain, using a demand and supply diagram, how more cocoa exports to the USA could change the exchange rate of the kell. [4 marks]
(a) The price of one currency (1) in terms of another currency (1).
(b) $200 ÷ 0.50 (1) = K400 (1). (K1 = $0.50 means each dollar buys K2, so $200 buys K400.)
(c) The higher interest rate means savers in other countries can earn more by saving in Zarmian banks (1). To do this they must buy kells (1). This increases the demand for the kell (1).
(d) The vertical axis is the exchange rate ($ per K1) and the horizontal axis is the quantity of kells (1). More cocoa exports mean US buyers need more kells, so the demand curve shifts right from D to D1 (1). The curves cross at a higher point, so the equilibrium rate rises from P1 to P2 (1) and the quantity traded rises from Q1 to Q2 (1).
In a currency diagram question, name what is on each axis and say which curve shifts and why. Marks are often lost for a missing axis label.